How to Read a Strategy Backtest: Trace the Conclusion Back to the Evidence
A backtest is not a return leaderboard. This guide shows how to verify the research question, tradability, time boundaries, costs, benchmarks, and falsification tests before treating a historical result as evidence rather than a promise.
The most useful thing a backtest can tell you is not an eye-catching annualized return. It is whether you can identify the conditions under which the result holds, the conditions under which it fails, and whether the idea deserves further study. Treating a backtest as a chain of evidence rather than a scorecard prevents most misreadings.
Why a smooth curve lowers our guard
A backtest chart is unusually persuasive. It compresses years of choices, doubts, and costs into a line that seems to rise neatly from left to right. We see a smooth story after the outcome is known, not the branches that were impossible to foresee at the time. That is why a backtest is so easily mistaken for a promise that following the same steps will reproduce the result.
That does not make backtests worthless. A good one turns an intuition into something that can be challenged, reproduced, and improved. The limitation is more precise: it usually answers what a rule would have done during one historical period. It does not tell us what the future must do, or whether every reader could live through the path. Investment stories become misleading when those questions are collapsed into one.
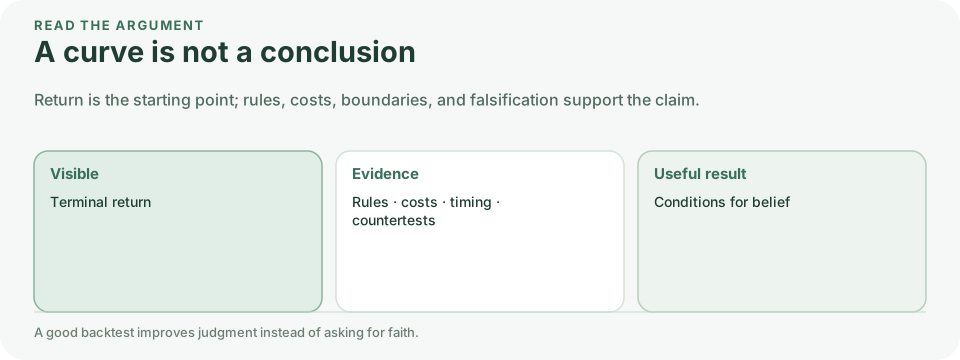
Before reacting to the return, pause and ask a plainer question: If this curve were starting today, what reasons would I have to keep believing in it? That moves attention from the endpoint back to the process and exposes assumptions that the line itself does not show.
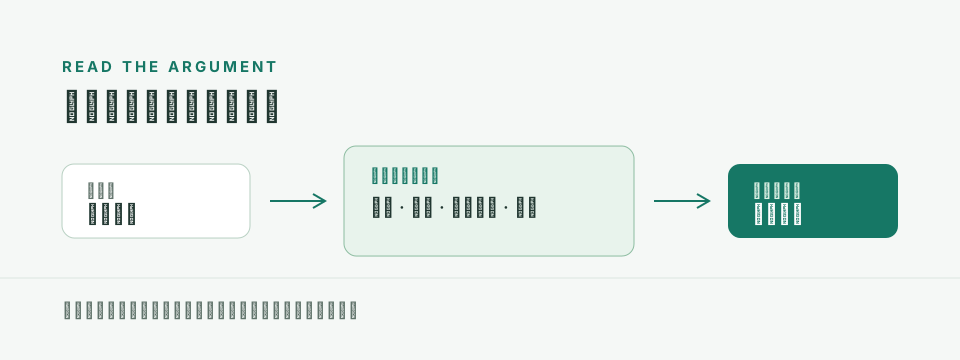
Diagram | Moving from seeing a return to understanding the evidence.
Ask the question before reading the return
A backtest should answer a falsifiable question. One example is: “Within a stated stock universe, did a screen using only information available by the previous trading day improve the return–drawdown trade-off over a specified period?” Without a defined universe, start and end dates, rebalancing frequency, and evaluation measure, the percentages that follow have no clear object.
Start by checking the sample boundaries. Were delisted stocks included? How were newly listed companies handled? Could orders actually execute during suspensions or limit-up and limit-down days? What was the data cutoff? These are not footnotes. They determine whether the result can be reproduced and whether its conclusion can travel to another period.
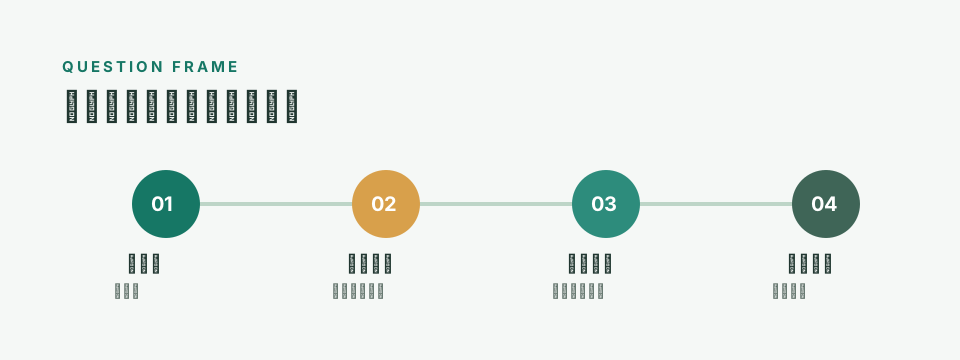
Diagram | Define the object of study and the decision rule before looking at results.
The rules must have been executable at the time
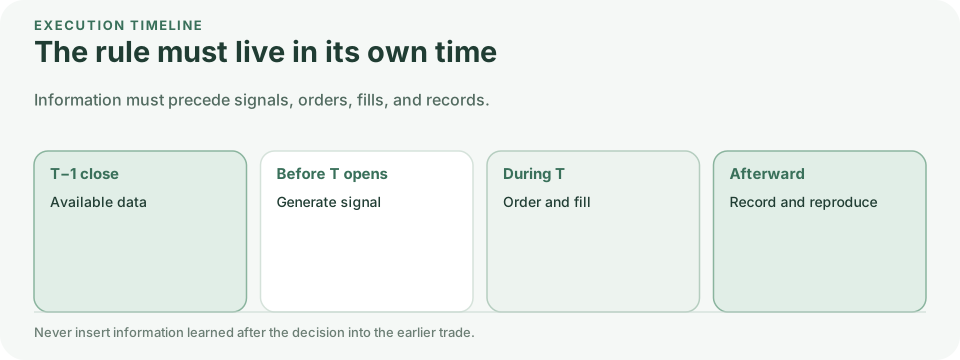
A rule should be specified well enough to recalculate it one day at a time: when the signal is generated, which information was then available, when the order is placed, which price is used, and how positions are sized. A model that trades at today’s open using data known only after today’s close has look-ahead bias. A historical test built from a list of companies that survived to the present has survivorship bias.
Two simple checks catch many such problems. First, standing just before the market opened on a given day, would you already have had every required input? Second, if another researcher received the same rule, would they produce the same changes in holdings? If either answer is unclear, the strategy is still an idea rather than a testable piece of research.
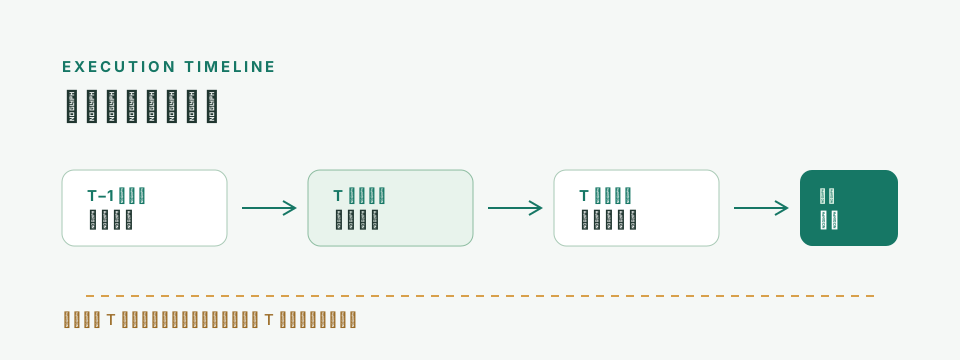
Diagram | Executability begins with putting information and trades in the right order.
Costs, cash, and corporate actions still count
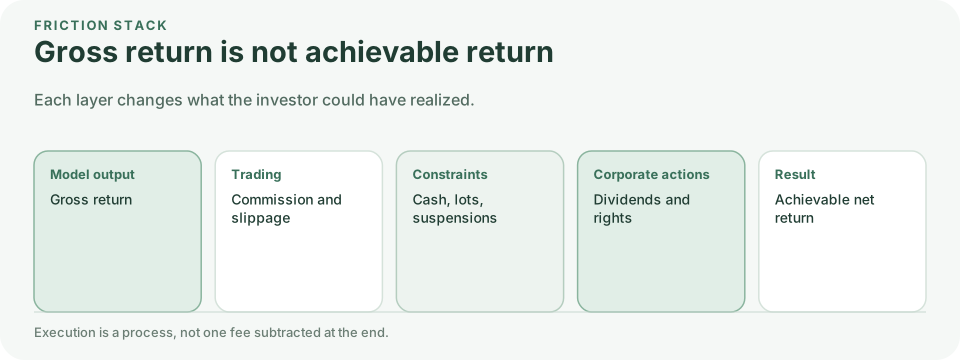
Friction changes what a strategy can actually deliver. Commissions, stamp duty, slippage, minimum trade sizes, residual cash, dividends, rights issues, and suspensions should all be stated and treated consistently. Omitting them tends to overstate results, especially for strategies with high turnover or many small positions.
The strategy archives on this site preserve the trading, valuation, and dividend assumptions used in their original studies. Those assumptions are not necessarily identical and should not be flattened into a simple ranking. When you see a terminal portfolio value, ask whether it includes idle cash, how dividends were handled, and whether costs are model assumptions or traceable transaction-level records.
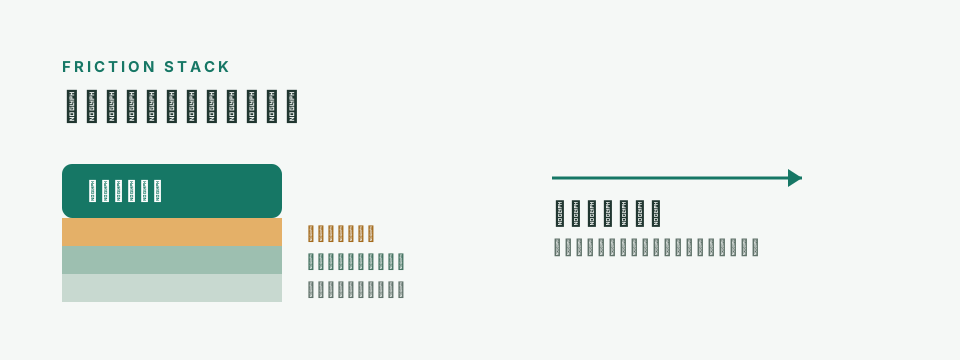
Diagram | Friction is a sequence of adjustments, not one universal fee.
Translate results into decisions
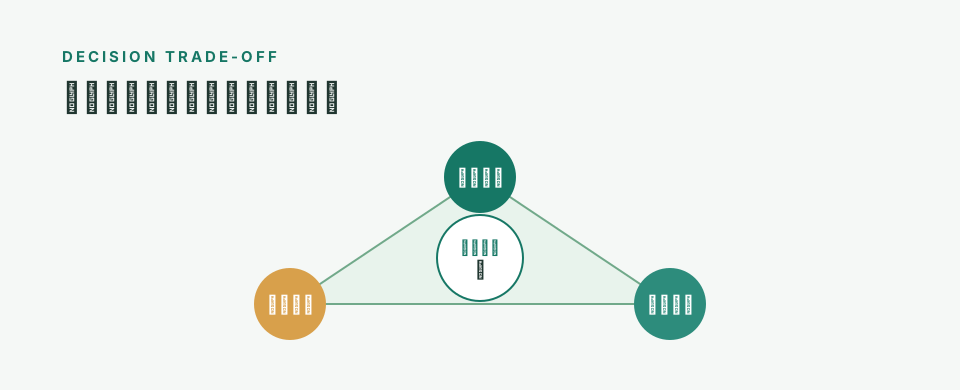
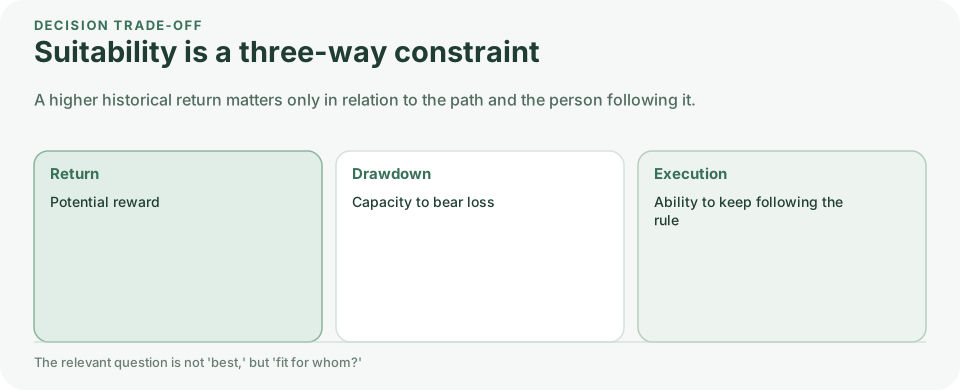
“It earned more over the past ten years” is not a complete conclusion. Anyone making a real decision still needs to ask at least three questions. How much volatility and turnover purchased that possible excess return? How long did the worst stretch last? When the strategy trailed its benchmark for an extended period, what reason would have kept an investor from abandoning it at the worst moment?
There is no universal answer. One person needs a shallower drawdown; another can tolerate a long wait; someone else cares most about whether the rule is simple enough to follow for years. A backtest should not choose those preferences for the reader. It should put all of the costs on the same ledger. Reporting only the most flattering statistic removes a trade-off that belongs to the decision-maker.
Research that explains who a strategy may suit—and who it may not—is usually more honest than a claim to have beaten the market. A useful strategy note describes both why an approach might work and the circumstances that would make holding it especially difficult.
Diagram | A strategy is only “good” in relation to the investor’s capacity and constraints.
Put the benchmark on the same footing
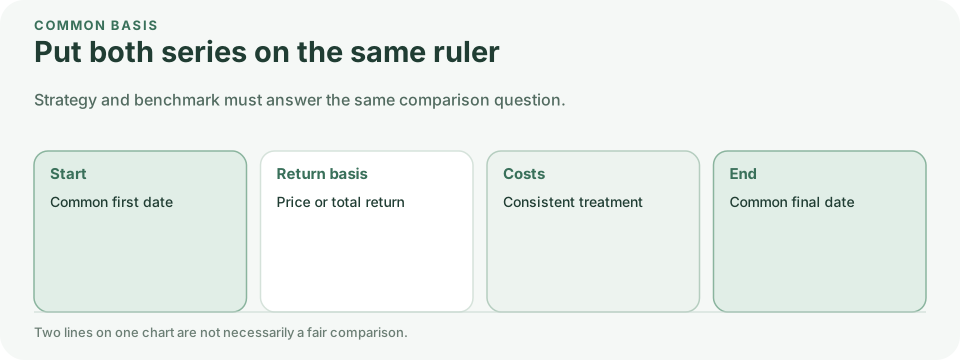
Comparison does not end when two curves appear on the same chart. The strategy and its benchmark should at least be normalized from the first date available to both, with a clear statement of whether the benchmark is a price index or a total-return index. A price index excludes cash dividends; a total-return index generally assumes reinvestment. Mixing the two can turn a difference in methodology into apparent “alpha.”
Annualized return should also be read alongside maximum drawdown, annual path, concentration, and turnover. An average return cannot erase an intolerable interim loss, nor does it reveal whether the result came from a handful of months or securities.
Diagram | A fair comparison starts with consistent dates and measurement conventions.
A curve conceals the experience of the path
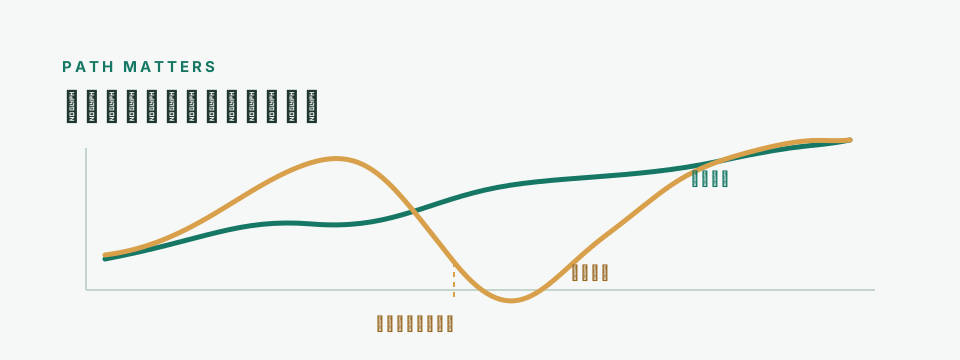
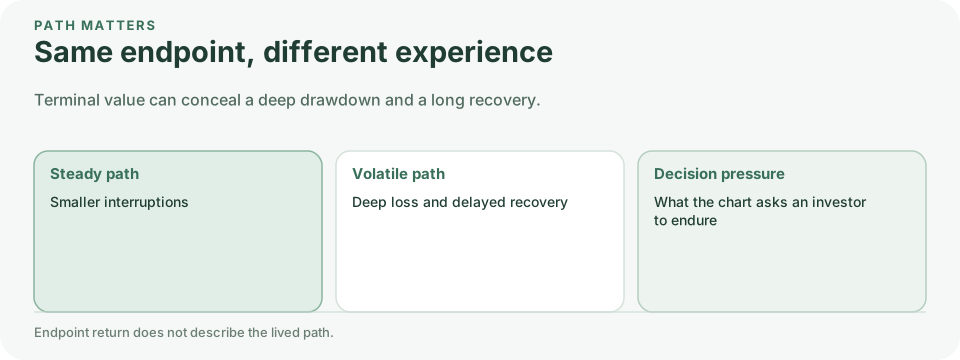
A historical maximum drawdown is not an abstract percentage. It corresponds to real plans under pressure, doubts about one’s own judgment, and regret while other assets rise. Two strategies can finish at the same value while imposing entirely different waits, volatility, and decision stress along the way.
That is why an endpoint alone is a poor guide to what a person can bear. Many strategies look “obviously worth holding” in hindsight, yet contain stretches that would have shaken most investors. A backtest cannot make you live through those periods, but it should show them: when the deepest drawdown occurred, how long recovery took, whether a few extreme months supplied most of the gain, and whether holdings ever became highly concentrated.
Researchers should also avoid turning “theoretically tolerable” into “easy to follow in practice.” Executability includes more than receiving a quoted price. The rules must be clear, the risks described in advance, and an investor under pressure must still have reasons to follow the process.
Diagram | The same terminal return does not imply the same lived pressure.
Record what did not happen
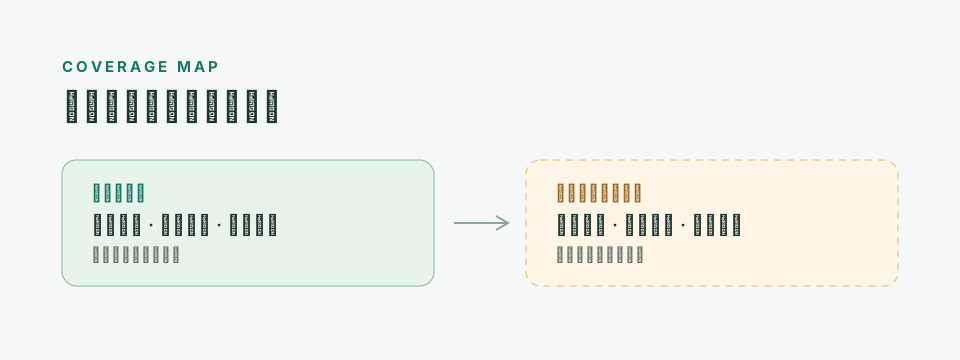
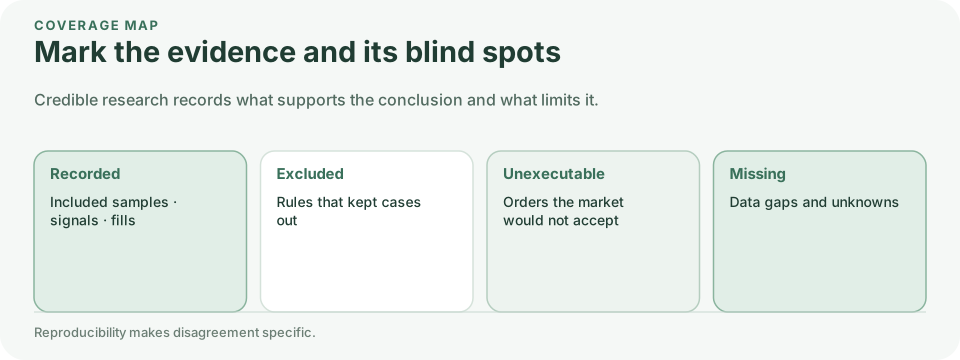
An attractive result pulls attention toward what was bought and how much it earned. Credibility also lives in what never entered the final result: securities excluded by the rules, signals that did not fire, days when a constraint prevented a trade, and extreme cases omitted because the data were inadequate. Showing only the winners that remain makes a rule look calmer in hindsight than it was at the time.
This does not require every article to print every raw record. It does require the researcher to state selection thresholds and missing coverage. Readers can then ask whether the rule works only inside a sample chosen with knowledge of later winners, and whether failed trades, periods in cash, and unexecutable signals received the same attention. A study that identifies its blind spots tells us both where the conclusion applies and where it stops.
Those boundaries also make disagreement productive. Another reader can start from the same material and reach a different conclusion. Reproducibility does not require everyone to agree; it anchors disagreement in rules, measurement, and evidence instead of storytelling skill. For long-running research, that kind of transferable transparency matters more than one round of striking performance.
Diagram | Credible research maps both its coverage and its blind spots.
Look for evidence that could overturn the result
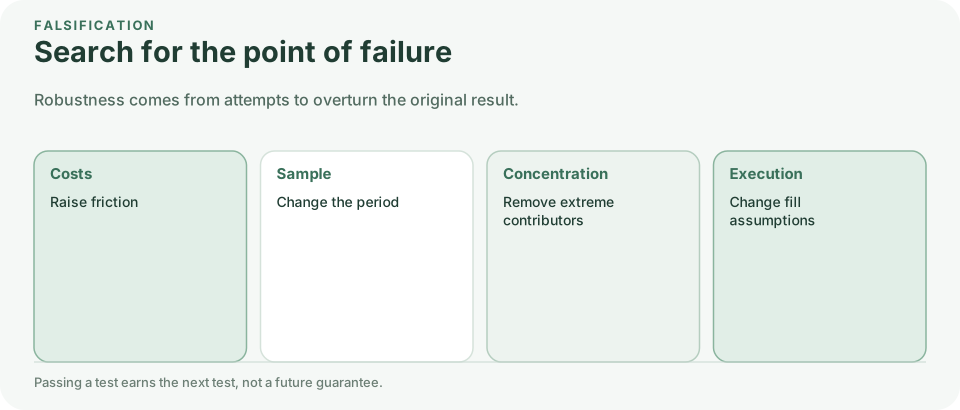
Serious research states the conditions under which it would fail. Does the result survive another reasonable cost assumption? Does it persist after removing the highest-contributing stock or year? Do different market regimes, dividend treatments, and whole-share rules point in the same direction? The aim is not to improve the curve but to measure how fragile the conclusion is.
Passing these checks only makes a strategy worthy of the next stage: out-of-sample testing, paper execution, or continued monitoring. It never turns a backtest into a promise of future returns. The better reading order is to begin with the research question and data boundaries, move to the rules and costs, and only then inspect the plotted result.
Diagram | The most valuable check is a deliberate search for where the conclusion fails.
Match the claim to the strength of the evidence
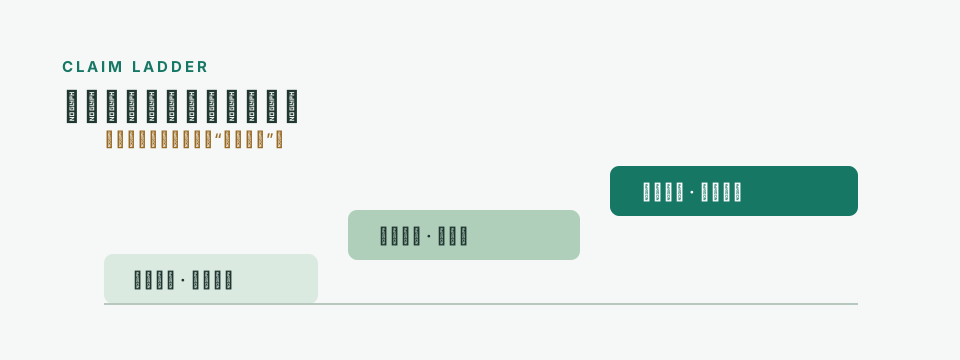
Careful research writing does not make every conclusion vague. It makes the wording proportional to the evidence. With one historical period and one parameter set, “worth further study” may be justified. After reasonable cost assumptions, varied market regimes, and independent replication, a researcher may say the result shows some robustness. Neither stage warrants “proven to work in the future.”
That boundary does not weaken an article. It shows readers which parts have support and which still await evidence. A testable question is more useful than a briefly exciting answer: If the next period differs from the past, how could this rule still earn the right to be held?
The best outcome of a backtest is better judgment, not relief from judgment. A reader need not immediately accept or reject a strategy. If the research helps them state the conditions they believe, the costs they cannot accept, and the evidence they still need, it has done something more important than report a return. It also creates a sound basis for later updates: let new evidence change the conclusion instead of recruiting evidence after the fact to defend it.
Diagram | Research language should stop where the evidence stops.