Before ranking a backtest by its annual return, turn back a few pages. Were those stocks available to buy? Did the signal exist before the trade? Were dividends and costs included? The answers determine what the plotted return means. This guide follows the order in which you might check a report.
Why a smooth curve lowers our guard
Shrink more than a decade of account history into one chart, and several losing years can look like a small dip. The higher the endpoint, the easier that wait seems to have been. But the historical chart already knows the ending. The investor at the time did not.
A backtest turns an investment idea into rules that can be recalculated. It helps show where those rules worked and where they failed in the past. Its answer depends on the sample and assumptions. Another period, or an investor unable to bear the interim losses, could produce a different outcome.
Start with this question: if I began following these rules today, without knowing the ending value, what evidence would support continuing and what would make me stop? The report should supply material for an answer.
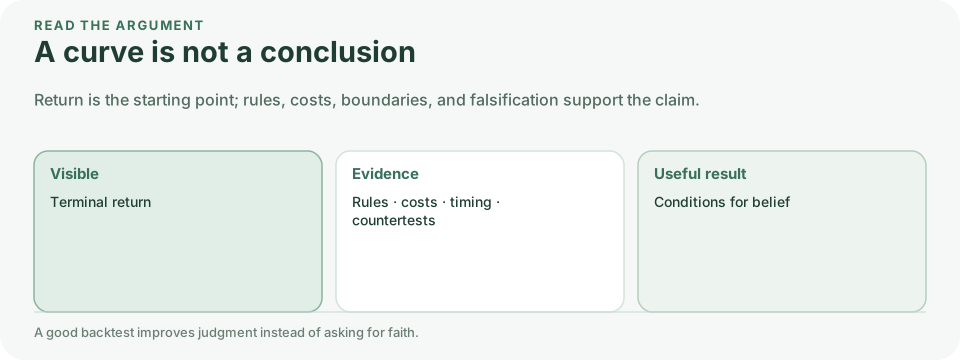
Ask the question before reading the return
A backtest should answer a falsifiable question. One example is: “Within a stated stock universe, did a screen using only information available by the previous trading day improve the return–drawdown trade-off over a specified period?” Without a defined universe, start and end dates, rebalancing frequency, and evaluation measure, the percentages that follow have no clear object.
Next check the sample. Are delisted stocks included? How are recent listings treated? Could orders fill during suspensions or limit-up and limit-down days? When do the data end? Missing securities and trading restrictions can change the result.

The rules must have been executable at the time
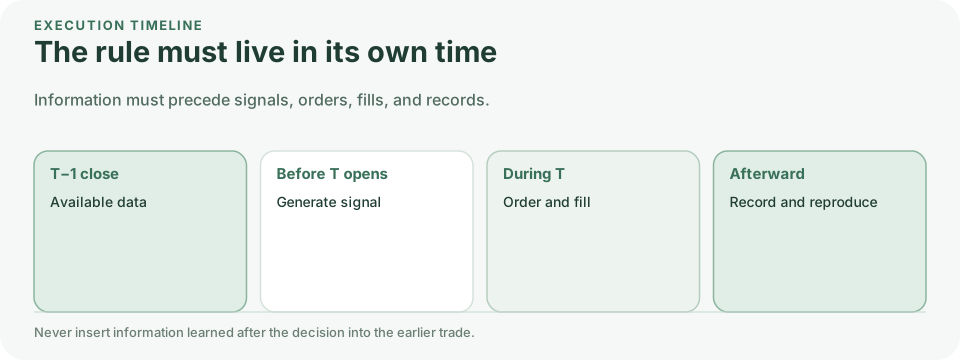
A rule should be specified well enough to recalculate it one day at a time: when the signal is generated, which information was then available, when the order is placed, which price is used, and how positions are sized. A model that trades at today’s open using data known only after today’s close has look-ahead bias. A historical test built from a list of companies that survived to the present has survivorship bias.
Choose a trading day and try to recalculate its signal using only information available before the open. Then reconcile the order, fill, and holding records. If the rule is too vague to do that, clarify it before discussing returns. Another researcher given the same inputs should be able to reproduce those records.
Costs, cash, and corporate actions still count
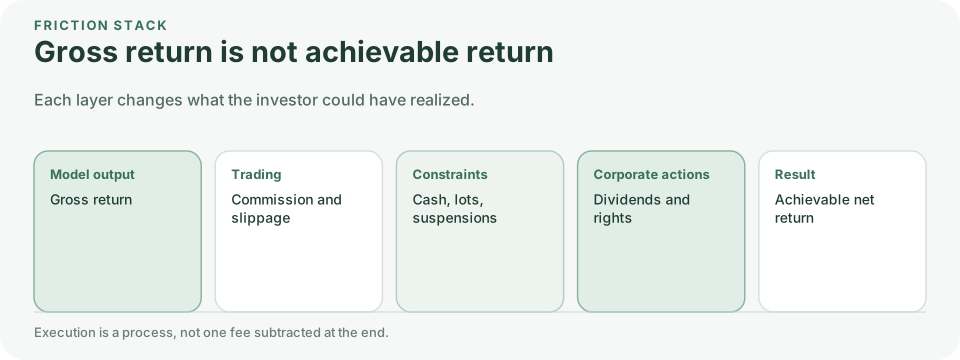
Friction changes what a strategy can actually deliver. Commissions, stamp duty, slippage, minimum trade sizes, residual cash, dividends, rights issues, and suspensions should all be stated and treated consistently. Omitting them tends to overstate results, especially for strategies with high turnover or many small positions.
The strategy archives previously shown on this site preserved the trading, valuation, and dividend assumptions used in their original studies. Those assumptions are not necessarily identical and should not be flattened into a simple ranking. When you see a terminal portfolio value, ask whether it includes idle cash, how dividends were handled, and whether costs are model assumptions or traceable transaction-level records.
What did the return require?
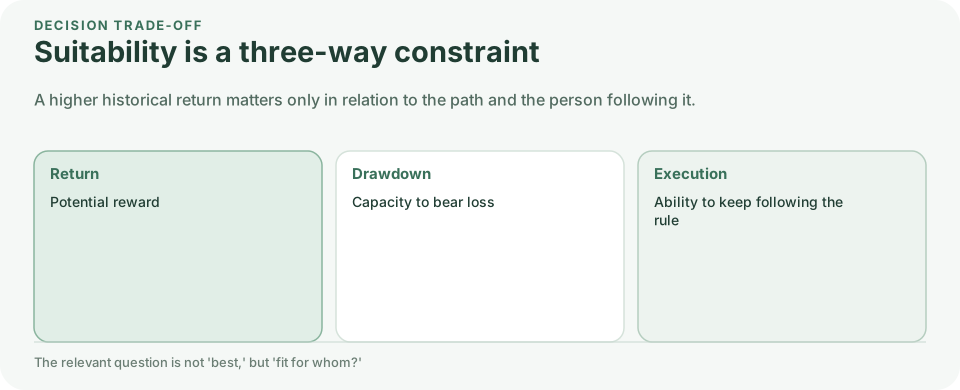
When a report says a strategy earned more over the past decade, check what that return required: how much turnover, how long the worst stretch lasted, and whether anyone changed the rules during a prolonged period of underperformance. Those records help more than an assurance that the strategy can be held for years.
A two-year wait may be too long for someone who needs the cash soon. Someone comfortable with volatility may find frequent trading or complex rules harder to manage. A backtest should supply the information needed to make those choices. Annual return alone leaves out much of the decision.
A strategy note should also describe what makes it hard to follow: a sector that lags for years, concentrated holdings, or a rule that calls for fresh cash during a decline. Readers can then judge whether their funding arrangements support execution.
Put the benchmark on the same footing
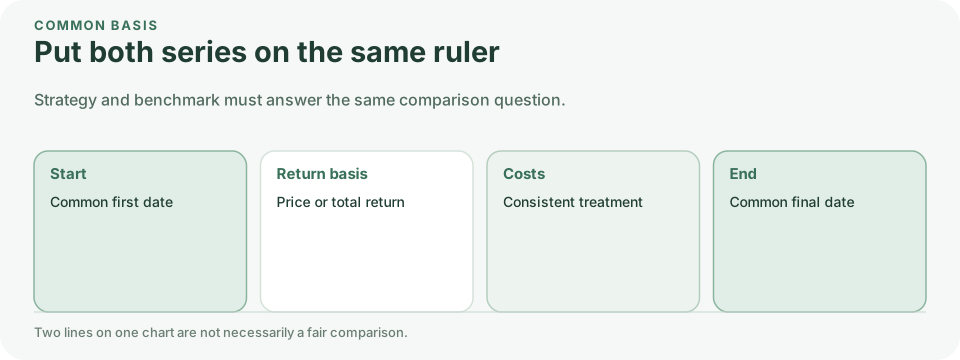
Comparison does not end when two curves appear on the same chart. The strategy and its benchmark should at least be normalized from the first date available to both, with a clear statement of whether the benchmark is a price index or a total-return index. A price index excludes cash dividends; a total-return index generally assumes reinvestment. Mixing the two can turn a difference in methodology into apparent “alpha.”
Annualized return should also be read alongside maximum drawdown, annual path, concentration, and turnover. An average return cannot erase an intolerable interim loss, nor does it reveal whether the result came from a handful of months or securities.
Examine the hardest stretch
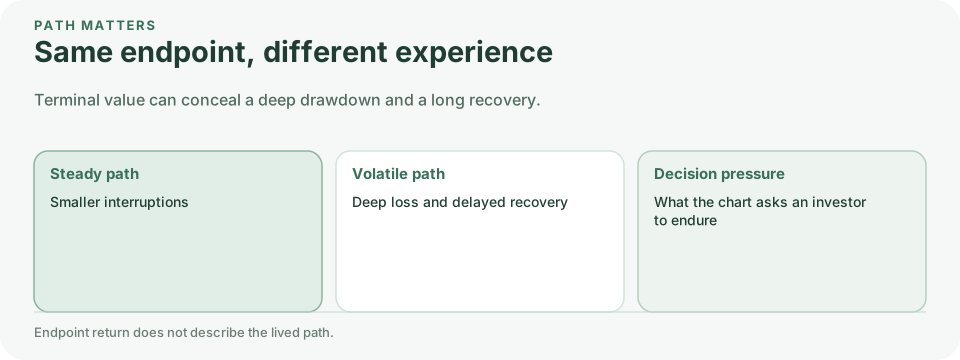
Living expenses do not pause when an account falls. Investors may also doubt their judgment or regret missing assets that are rising elsewhere. Two strategies with the same final return can therefore demand very different tolerance for stress.
Enlarge the worst stretch of the chart. When did the decline begin? How long did recovery take? Was cash added along the way, and did holdings become more concentrated? Check whether a few months supplied most of the gain. A backtest cannot give readers the experience in advance, but it can show how long the strain lasted.
A report can establish that a rule was executable in its model. It should not infer that people will find the rule easy to follow. Clear instructions, risks disclosed in advance, and adequate funding each need separate attention.
Check excluded samples and unfilled orders
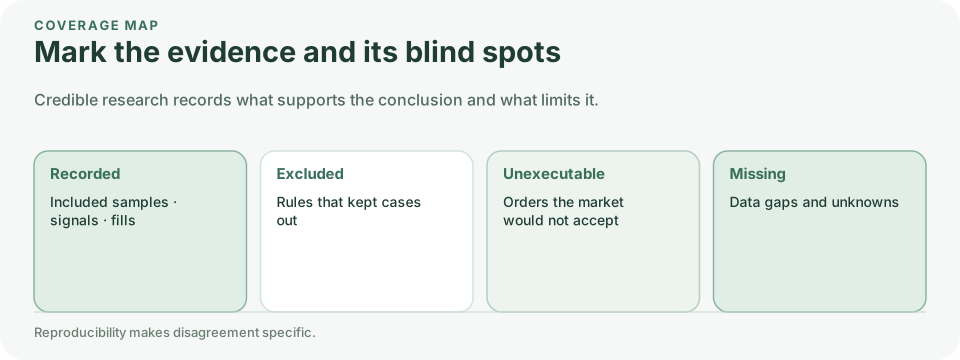
Look at what the final return table leaves out: rejected securities, signals that never fired, orders blocked by trading restrictions, and dates skipped because data were missing. Keeping only successful fills can make a strategy look easier to use than it was.
The article need not print every record. It should state the selection criteria and gaps, and make failed trades, periods in cash, and unfilled signals traceable. In particular, check whether the sample was chosen after its eventual winners were known.
These details help the next researcher. Someone who disagrees with the conclusion can reuse the inputs and identify whether the disagreement comes from rules, data, or interpretation. Without that material, readers can assess the prose but have little basis for assessing the study.
Look for evidence that could overturn the result
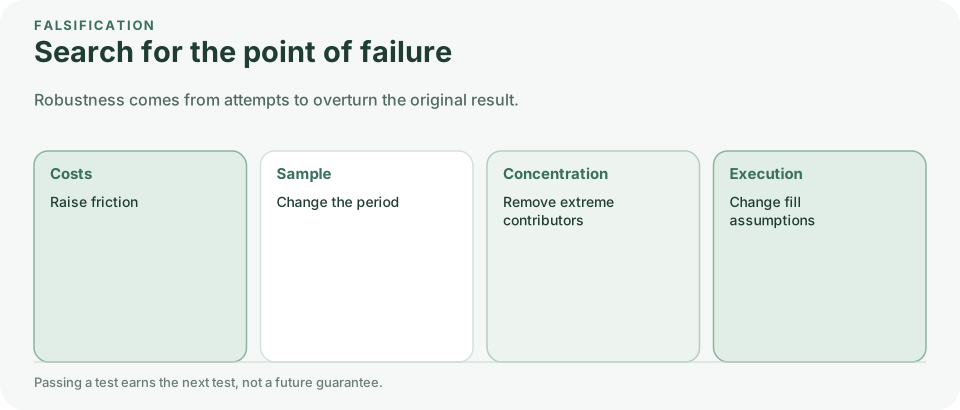
Try changes that could overturn the conclusion: raise costs, remove the best-performing stock or year, choose another market period, or alter dividend and whole-share assumptions. Record where the result weakens, including tests that make the strategy look worse.
Passing these checks only makes a strategy worthy of the next stage: out-of-sample testing, paper execution, or continued monitoring. It never turns a backtest into a promise of future returns. The better reading order is to begin with the research question and data boundaries, move to the rules and costs, and only then inspect the plotted result.
Match the claim to the strength of the evidence
One historical period and one parameter set may justify further study. Reasonable costs, varied market conditions, and independent replication give more grounds for discussing robustness. Even then, they cannot establish that a strategy will work in the future.
The conclusion can list what remains unresolved: out-of-sample performance, the gap between simulated and actual fills, or replication with another dataset. Readers can then distinguish existing evidence from planned work.
After reading, write down the conditions you would accept, the losses you could not bear, and the evidence still missing. Revisit that record when the study is updated. If the evidence has changed, the conclusion should change with it.

When applying this checklist to any strategy report, first check whether its public materials actually include the rules, sample period, cost assumptions, daily records and failure conditions. Three strategy archives previously shown on this site have left the public website, so we no longer present them as examples a reader can open directly. Readers seeking to verify a particular historical study can describe the material they need through the contact page. Without accessible original records, treat the relevant conclusion as independently unverified.