A monthly spending allowance of RMB 2,000 costs RMB 24,000 a year. At a 5% dividend yield, RMB 480,000 appears sufficient. The division is correct. The estimate leaves several things out: whether the dividend per share will fall, when the cash will arrive, whether selling triggers a tax adjustment, and what happens to the assets after the income has been spent.
How much of the assumed dividend survives?
This article grew out of community discussions about accumulating shares for income. Some participants wanted to know whether buying before a record date qualifies for a dividend. Others confused the current dividend yield with the cash their existing shares would receive. Several had already considered collecting irregular payments and transferring a monthly allowance to a spending account. Treating all of them as people chasing effortless wealth would miss the practical question: can the budget withstand a smaller dividend or an urgent bill?
Start with the cash per share. An investor holding 10,000 shares receives RMB 5,000 before tax if the distribution is RMB 0.50 per share. If the share price falls from RMB 10 to RMB 8 while that dividend stays unchanged, the payment remains RMB 5,000. The yield measured against the new market price rises from 5% to 6.25%. A falling share price does not mechanically reduce an already determined dividend by the same percentage. The business problems behind the price decline may, however, affect the next payment.
A higher yield after a fall therefore means different things to different investors. A new buyer pays less for the same historical distribution. An existing holder also has a capital loss. One current yield cannot describe both investors' returns because their entry costs differ. Nor does a historical dividend prove that the same amount will be paid again.
| Term | What it tells you | What to check |
|---|---|---|
| Dividend per share, or DPS | Cash distributed for each eligible share | Attribution year, tax basis and special dividends |
| Historical dividend yield | Past distributions divided by a specified price | Price date and distribution period |
| Proposed distribution | What the board intends to distribute | Approval and implementation still matter |
| Approved distribution | How far the decision has progressed | Approval does not establish receipt in an account |
| Implementation notice | Who qualifies and the relevant dates | Share classes may have different dates and tax rules |
| Payout ratio | Cash distributed relative to a profit measure | Whether buybacks are included and which accounting basis is used |
The required capital changes sharply when the assumptions are less favorable. The following table uses an illustrative initial gross yield of 5% and an annual cash requirement of RMB 24,000. It does not select securities or forecast a market yield. Dividend cuts and effective tax rates are stress inputs. Tax means the eventual burden, rather than an assertion that it is always withheld on the payment date.
| Reduction in assumed DPS | Assumed effective dividend tax | Required equity capital | Increase from RMB 480,000 |
|---|---|---|---|
| 0% | 0% | RMB 480,000 | Base case |
| 20% | 0% | RMB 600,000 | RMB 120,000 |
| 40% | 0% | RMB 800,000 | RMB 320,000 |
| 0% | 20% | RMB 600,000 | RMB 120,000 |
| 20% | 20% | RMB 750,000 | RMB 270,000 |
| 40% | 20% | RMB 1,000,000 | RMB 520,000 |
The calculation is annual spending divided by the product of assumed yield, one minus the dividend cut, and one minus the effective tax rate. It excludes a cash reserve and transaction costs. It tests whether a year's distributions meet a year's spending; it says nothing about whether the invested capital retains its market value.
A plan that works only with unchanged dividends, no tax and no unexpected spending has little room for error. A more useful starting point is to separate bills that must be paid on time from purchases that can wait. Then calculate the shortfall under a smaller dividend. That avoids turning the largest historical payment into a permanent standard of living.
On the ex-dividend date, wealth changes its location
Suppose an investor buys 10,000 shares at RMB 10 and the price remains unchanged until the distribution. Ignore tax and fees. With a cash dividend of RMB 0.50 per share and no other corporate action, the simplified ex-dividend reference price is RMB 9.50. The reference value of the shares falls from RMB 100,000 to RMB 95,000, with RMB 5,000 of dividend cash alongside it. The sum is still RMB 100,000.
This is the basic cash adjustment in section 4.3 of the Shanghai Stock Exchange trading rules. A reference price connects the pricing basis across the corporate action; actual trades still depend on buyers and sellers. The formula cannot guarantee the next opening price or a subsequent recovery. For the rule version, this article checked the exchange's 2026 revision notice, formal attachment and deferred-provisions list. Section 4.3 is not among the provisions deferred by that notice. Exchange notice and attachments.

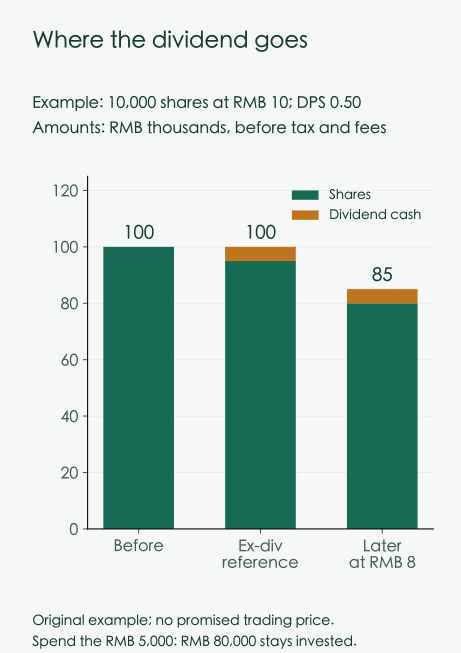
If the share price later falls to RMB 8, the shares are worth RMB 80,000. Adding the retained RMB 5,000 gives RMB 85,000, a 15% loss against the original investment. That result already includes the dividend. Adding a further 5% dividend return would count the same cash twice. If the RMB 5,000 has paid living expenses, only RMB 80,000 remains in the account, although the withdrawal still belongs in the historical investment record.
| State of the same investment | Share value | Dividend cash retained | Withdrawn and spent | Assets plus cumulative withdrawals |
|---|---|---|---|---|
| Before payment | RMB 100,000 | 0 | 0 | RMB 100,000 |
| Ex-dividend reference | RMB 95,000 | RMB 5,000 | 0 | RMB 100,000 |
| Later at RMB 8, cash retained | RMB 80,000 | RMB 5,000 | 0 | RMB 85,000 |
| Same price, dividend spent | RMB 80,000 | 0 | RMB 5,000 | RMB 85,000 |
The last column reconciles where the investment went. Money already consumed cannot be sold or reinvested today, and recording it does not protect the remaining capital. This example has one initial contribution, so a simple holding-period return is informative. Repeated contributions and withdrawals require their dates and a money-weighted or appropriately segmented return calculation. Reusing the original denominator for every cash-flow pattern produces misleading comparisons.
A negative broker cost figure needs similar care. Some displays deduct dividends or sale proceeds from the original outlay. That can help track recovered cash, but it does not erase the market value of the remaining shares. If those shares are worth RMB 100,000 today and RMB 70,000 later, current wealth has fallen by RMB 30,000, even if a cost field is negative. Broker conventions differ; trades, dividends and account cash movements provide the common evidence.
Dividends are useful because a company transfers distributable cash to its owners, who can spend it, repay debt or invest elsewhere. Their long-term value still depends on future business earnings, how retained money is used and the purchase price. Operating activity creates the earnings and cash. The ex-dividend adjustment does not produce an extra return, and it supplies no reason to promise that the price must recover the dividend amount.
Entitlement, payment and eventual tax are separate questions
A real implementation notice makes the distinction clearer. China Yangtze Power's final dividend attributable to 2025 was RMB 0.79 per share. Its record date was July 16, 2026, and both the ex-dividend date and cash payment date were July 17. An interim RMB 0.21 attributable to 2025 brought the financial-year total to RMB 1.00 per share. Qualification for the final payment follows that notice's registration conditions. The label "2025 dividend" does not mean that an investor had to own the shares throughout 2025. Implementation notice, pp. 1–3.
For an ordinary mainland individual holding listed shares acquired through the public issuance and transfer market, entitlement and the holding period used for dividend tax serve different purposes. Qualification does not require a year of prior ownership. The eventual dividend tax burden depends on the applicable holding period. The exemption language says more than one year; replacing that with a casual "one year or longer" can mishandle the boundary.
| Question | Applicable information | Budget implication |
|---|---|---|
| Does this holding qualify? | Registration conditions in the implementation notice | Establish eligible shares first |
| Holding period of no more than one month | Effective dividend tax of 20% | Gross cash may exceed final spendable income |
| More than one month, no more than one year | Effective tax of 10% | Sale may trigger a later collection adjustment |
| More than one year | Dividend individual income tax temporarily exempt | Current policy is not a permanent guarantee |
| When does cash or a tax adjustment appear? | Company notice, broker and settlement records | Payment and tax collection dates can differ |
The sources are Caishui 2015 No. 101 and the tax authority's explanation of holding periods. Actual holding time and rules such as first in, first out matter. Counting only the days since the dividend is insufficient. Yangtze Power's notice also explains that the relevant personal accounts initially receive the dividend without the corresponding withholding, with subsequent handling linked to disposal and holding period.
This creates a possible cash illusion: the gross dividend has arrived, so the investor assumes tax is settled. On an illustrative RMB 5,000 dividend with an eventual 20% effective burden, the tax is RMB 1,000. An earlier account credit of RMB 5,000 does not change the eventual RMB 4,000 retained. The example does not imply that every investor pays 20%; acquisition route, account status and holding period determine the applicable treatment.
The tax table is deliberately limited to that ordinary mainland individual A-share case. Hong Kong shares, Stock Connect, nonresident accounts, corporate accounts and depositary receipts have other rules. This English edition keeps the same scope. China Shenhua has both A and H shares, so a Hong Kong record date, payment date or tax rate cannot simply be copied into an A-share cash calendar.
Enough income for the year can still leave a July shortfall
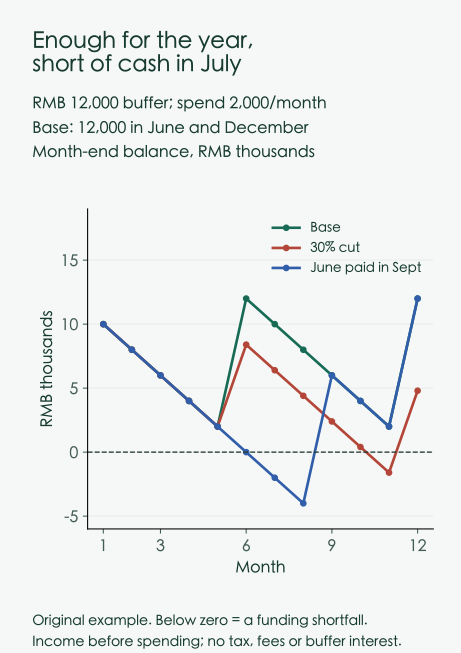
Put the RMB 24,000 back on a calendar. Assume spending of RMB 2,000 per month and a separate initial cash buffer of RMB 12,000. In the base case, RMB 12,000 arrives in June and December, before each month's spending. The buffer is additional to equity capital. Counting it as both invested shares and cash available for bills would duplicate the same resource.
By the end of May, the base-case buffer is down to RMB 2,000. June's dividend restores the month-end balance to RMB 12,000. Now reduce the annual dividend by 30%, so June and December each bring RMB 8,400. The balance reaches minus RMB 1,600 at the end of November. A negative chart value means spending must be reduced or another funding source found. The model does not grant an overdraft.
The third case keeps the full annual dividend but delays June's payment until September. The buffer runs out at the end of June; July and August have shortfalls of RMB 2,000 and RMB 4,000. Full-year receipts still equal RMB 24,000. An annual income-versus-spending comparison would miss the interruption entirely.

More frequent distributions can shorten some waiting periods without increasing annual income. Four payments of RMB 0.10 per share total less than one payment of RMB 0.60. Four receipts in a trailing twelve-month window may also combine interim and final payments attributable to different financial years. After counting the history, the next decision and implementation schedule still need checking.
During accumulation, reinvesting dividends can increase the number of shares. During a spending phase, dividends used for bills do not purchase additional shares. Both approaches are reasonable, but a compounding calculation must choose how the cash is used. A chart that assumes all dividends are spent and simultaneously credits the terminal value from full reinvestment uses the income twice.
Spending growth deserves a separate line. At a purely illustrative 2% annual increase, today's RMB 2,000 monthly expense becomes about RMB 2,438 after ten years, or RMB 29,256 annually. Flat nominal dividend income would cover less of it. This is not an inflation forecast. It explains why tracking actual expenses alongside receipts is more useful than fixing attention on today's headline yield.
Examine the cash a company earns before its payout percentage
Three nonfinancial businesses provide different tests of dividend durability. The table mainly uses their 2025 annual reports as a historical snapshot of one complete financial year. It does not double a 2026 half-year figure to manufacture a full-year result. Amounts are in RMB billion. These are mechanism examples, not a recommended portfolio or a ranking based on one cash-flow column.
| Full year 2025, RMB billion | Yangtze Power | Daqin Railway | China Shenhua |
|---|---|---|---|
| Profit attributable to owners, China Accounting Standards | 34.503 | 5.900 | 52.849 |
| Net operating cash flow | 60.563 | 4.987 | 75.059, IFRS disclosure |
| Cash outlay for long-term assets, each report's line item | 18.488 | 27.181 | 46.674, IFRS disclosure |
| Simple difference between those cash figures | 42.074 | −22.195 | 28.385 |
| Cash dividends attributable to the year | 24.468, implementation basis | 4.426, annual-report plan | 41.811, annual-report estimate |
| Gross dividend per share | RMB 1.00 | RMB 0.22, annual-report plan | RMB 2.01, interim plus final |
Sources: Yangtze Power 2025 annual report, pp. 6, 40 and 88; Daqin 2025 annual report, pp. 6, 38 and 76–77; Shenhua 2025 annual report, pp. 5–6, 149–150 and 251–253. Shenhua's figures use the consolidation scope in that annual report. Its later 2026 restructuring changes the comparison discussed below.
The subtraction is only a rough cash observation. It does not consistently deduct acquisitions, leases, interest, distributions to noncontrolling interests or net debt repayment, and the asset-outlay categories are not identical. It should not be labeled cash fully available to ordinary shareholders. Likewise, a planned or estimated distribution explains the company's decision but does not establish receipt in a personal account. Daqin's final implementation status is not established by this annual-report comparison.
Yangtze Power: water, investment and financing all matter
Yangtze Power's 2025 profit attributable to owners rose 6.17%, while operating cash flow rose 1.53%. Both increased, but at different rates. Accounting recognition and noncash items affect profit; collections and payments affect cash. Applying the profit growth rate directly to future distributable cash would skip these distinctions.
The operating constraints of hydropower are concrete. Water availability and dispatch influence generation, market arrangements affect electricity prices, and construction and financing determine some uses of cash. A mature operating station does not mean that the group has no future construction program. Long-term asset cash outlays were about RMB 18.488 billion in 2025, alongside substantial debt maturities and refinancing activity. The entire operating cash balance cannot be treated as discretionary distribution capacity.
In the first half of 2026, owners' profit was about RMB 14.756 billion, up 13.02%, while operating cash flow was about RMB 24.128 billion, up only 0.57%. This extends the observation that profit and cash growth differ. It does not, on its own, establish a collection problem or predict the full-year growth rate. Seasonality, operating receipts and payments, and the notes still need examination. 2026 interim report, p. 6.
The published 2026–2030 dividend-planning document describes a cash payout of at least 70% of profit attributable to owners, together with a profitability condition and provisions for adjustment. The text describes a distribution framework. It does not replace each year's actual decision or mean a 70% return on the share price. If the profit base contracts, maintaining the same payout percentage can still produce a smaller cash distribution. Planning announcement, pp. 2–3.
For an income budget, the relevant follow-up is therefore specific: what happened to generation and realized pricing, how much cash is being committed to projects, and how do financing needs affect the next distribution? A favorable water year can support earnings without answering every one of those questions. Conversely, a weaker period should be examined in its seasonal and operational context before it is treated as a permanent deterioration.
Daqin Railway: a high payout ratio can coexist with falling earnings
Daqin provides a useful counterexample to judging income by payout percentage alone. Profit attributable to owners was approximately RMB 11.930 billion in 2023, RMB 9.039 billion in 2024 and RMB 5.900 billion in 2025. Operating cash flow over the same years was RMB 17.246 billion, RMB 9.317 billion and RMB 4.987 billion. The 2025 annual-report cash dividend plan amounted to 75.02% of owners' profit. That high ratio is not evidence of growing profit.

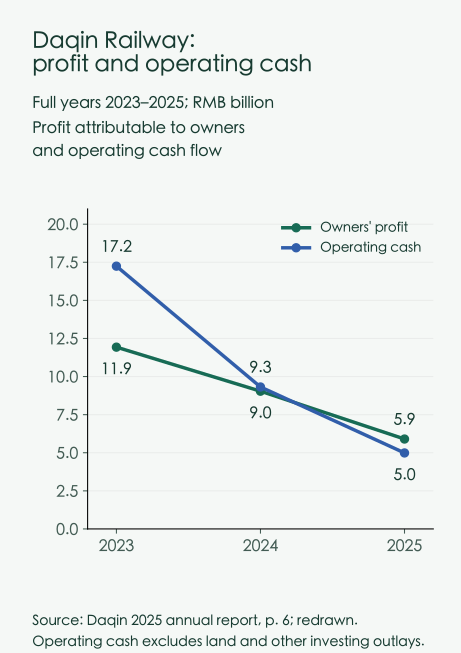
Revenue increased 4.04% in 2025, but operating costs rose 12.25%, while coal dispatch volume fell 6.8%. The report discusses changes in freight mix, pricing and costs including connecting transport services. More revenue did not translate into a comparable increase in shareholder profit. This is closer to the economics of a dividend than descriptions of the assets as large or important. The coal dispatch measure also differs from traffic on the Daqin line itself, which fell 0.5% that year.
One unusual cash item needs care. In 2025, the company paid approximately RMB 25.700 billion, including tax, for land-use rights, with funding that included proceeds raised earlier through convertible bonds. This materially affected long-term asset cash outlays and helps explain the negative simple difference in the table. Treating the land purchase as an annually recurring maintenance expense would exaggerate ongoing pressure. Deleting it entirely would ignore a real use of capital. Subsequent maintenance, new projects and financing still need separate analysis.
The annual report also gives a combined dividend-and-buyback ratio of 79.22%, compared with 75.02% for cash dividends alone. Buybacks may affect the share count and per-share measures, but that cash is not paid pro rata into the accounts of investors who continue holding. Using 79.22% to plan household receipts confuses two ways capital can be returned. Strategic importance, willingness to distribute and capacity to distribute each need their own evidence.
A low cash balance after an exceptional investment does not by itself prove that the next dividend must be cut. A high payout ratio does not prove the dividend is comfortably funded indefinitely. Reading the operating results and the capital transaction together gives a question that can be followed into the next report. If every result is met with either "important assets are safe" or "less cash means danger," the analysis does little to help adjust a budget.
Shenhua: per-share cash, aggregate cash and calendar receipts can diverge
Shenhua's interim dividend attributable to 2025 was RMB 0.98 per share and its final dividend was RMB 1.03, totaling RMB 2.01. Shareholders approved the final distribution on June 26, 2026, as confirmed in the subsequent H-share update. That update's Hong Kong registration and payment dates are not used for an A-share cash calendar here. Final dividend update.
The annual report estimated total cash dividends attributable to financial year 2025 at about RMB 41.811 billion. Its cash-flow statement records approximately RMB 64.374 billion paid to the company's shareholders during calendar 2025. The latter includes the previous financial year's final dividend and the current year's interim dividend. Dividing that calendar cash payment by 2025 profit would not measure the payout attributable to the same financial year.
The two distributions also used different share bases. Multiplying the combined RMB 2.01 DPS by the latest share count need not reproduce the annual-report total. Each distribution has its own eligible shares and date. For an investor who added shares between payments, the personal cash calculation must likewise use the eligible holding at each event rather than the year-end holding for both.
Coal pricing, volume and the power business jointly influence this integrated energy company's earnings. Supporting transport operations affect its cost structure without eliminating the commodity cycle. An income analysis therefore needs business profitability, capital spending and cash allocated to different owners. IFRS operating cash flow was RMB 75.059 billion in 2025 and long-term asset cash outlays were RMB 46.674 billion. Leases, acquisitions, interest and distributions to noncontrolling interests remain additional considerations. Omitting a use of cash can overstate what is available for the ordinary shareholder.
In 2026, acquisitions create a further comparison problem. First-half IFRS profit attributable to owners was RMB 31.054 billion. The restated 2025 comparative was RMB 30.478 billion, giving growth of about 1.9%. Using the original RMB 26.706 billion comparative would produce about 16.3%, mixing a change in consolidation scope into the growth claim. The interim report explains the common-control acquisition and retrospective adjustments. 2026 interim report, pp. 7–8.

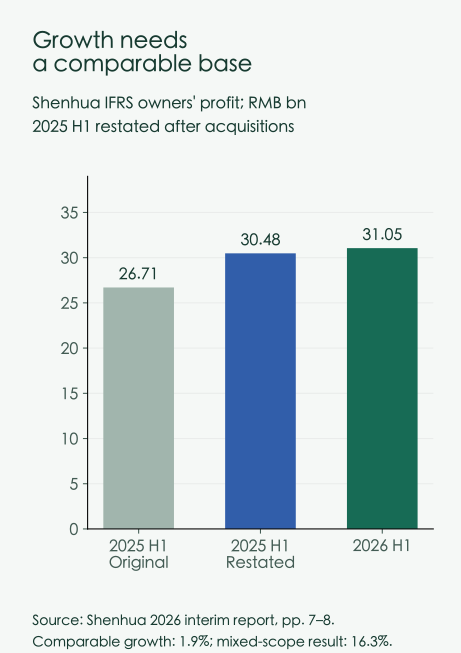
The same discipline applies to every per-share claim. Total profit may increase because assets were acquired. Aggregate dividends may rise while the share count increases. Someone holding one share needs to examine the cash attributable to that share, the capital risk attached to it and the source of the apparent growth. A larger corporate total does not answer all three.
A dividend ETF replaces some selection work with fund-level rules
With direct ownership, a company's dividend applies to the investor's eligible shares. Through a fund, the company first pays the fund. The fund accounts for its assets and liabilities, and its own contract, distributable income and distribution notice govern payments to unit holders. The first event does not guarantee the second on the same day or at the same proportion. A dividend-oriented name is not a monthly payment commitment.
Tax treatment also has separate levels. The tax authority's policy guide states that income investors receive from distributions by open-ended funds is temporarily exempt from individual income tax. Tax on the fund's underlying stock dividends follows its applicable rules. A direct-stock holding-period table cannot simply be applied to the time an individual holds ETF units. Nor does the unit holder's distribution exemption mean fund operations have no taxes or expenses. Shanghai tax authority's 2025 policy guide, p. 55.
| Issue | Direct A-share ownership | Domestic dividend ETF |
|---|---|---|
| Source and timing of cash | Company implementation notices | Underlying receipts, then the fund's distribution decisions |
| Choice of holdings | Investor chooses companies and weights | Fund and index rules determine holdings and changes |
| Monitoring work | Operations, capital and company distribution plans | Contract, costs, tracking, holdings and distribution rules |
| Limit of diversification | Actual portfolio design | Many holdings may share industry exposures |
| Tax review | Account status, acquisition route and holding period | Separate fund and unit-holder treatment |
| Return measurement | Market value change plus net dividends | NAV or price change plus net distributions, without double counting |
The product discussed in the community, 512890, provides a precise example of why exposure definitions matter. The manager's product page reports financial-sector exposure of 54.13% of fund net assets at June 30, 2026. The seven banks appearing in the top-ten holdings table have listed weights totaling 17.86%. These figures differ both in classification, financials versus banks, and in coverage, the entire portfolio versus the ten largest holdings. One cannot be used to disprove the other. Fund manager's product page, industry and holdings tables.
The 17.86% is an addition of seven rounded percentages and excludes banks outside the top ten. It is not the full bank allocation. The 54.13% figure cannot be relabeled bank exposure either. Both belong to a dated snapshot, not a permanent or live portfolio. This article does not infer the product's distribution frequency, fees or tracking rules from its name; those require its applicable contract and current disclosures.
Owning several securities can reduce the impact of an accident at one company. Owning several funds tilted toward similar financial or energy businesses may still expose income to the same profit cycle. Count underlying exposures when assessing industry diversification and actual payment dates when assessing cash timing. The number of fund codes answers neither question by itself.
Keep a record that can be updated next quarter
Instead of watching historical yield rankings every day, keep two compact records: evidence about the investments and a household cash calendar. The first tracks per-share distributions, their business funding and their decision status. The second tracks what actually reached the account and what must be spent. Actual eligible holdings connect the two, preventing a company's aggregate distribution from becoming an imaginary personal receipt.
| Review item | Evidence to retain | Change that requires a new budget |
|---|---|---|
| Next distribution | Proposal, approval and implementation recorded separately | Lower DPS or a moved payment date |
| Earnings support | Comparable profit and operating cash flow | Weaker profit, changed payment timing or earnings mix |
| Capital uses | Maintenance, projects, acquisitions and debt maturities | Less cash flexibility for distributions |
| Per-share basis | Eligible share count, issuance, buybacks and share changes | Aggregate growth fails to reach each share |
| Concentration | Full holdings and distribution calendar | Several receipts depend on one industry or month |
| Household spending | Bills, cash buffer and deferrable purchases | Essential spending rises or an unexpected bill arrives |
Someone with stable wages who uses dividends for travel or equipment can postpone a purchase after a smaller distribution. A person relying on dividends for rent has a different cash constraint. The latter needs a buffer and timing tests, and cannot settle an immediate bill by waiting indefinitely for the share price to recover. The distinction comes from payment deadlines, not a contest over who can tolerate a red portfolio screen.
Switching into an unfamiliar company for a higher historical yield also has costs beyond the first year's apparent income gain. Tax, trading costs, industry concentration and the possibility of a lower future distribution belong in the comparison. A special dividend deserves a separate entry: asset disposals or accumulated cash may support it, so carrying it into every future annual budget requires a fresh justification.
Banks need a different set of operating tests, including capital adequacy, asset quality and regulatory distribution constraints. The nonfinancial-company shortcut of operating cash minus long-term asset spending is not an adequate bank analysis. The existing A-share bank core-holdings study discusses banks and backtest measurement. This article concentrates on translating distributions into household cash, so the two pieces address different parts of the decision.
Whether dividends can fund part of living expenses comes back to amounts that can be checked: actual cash per share, net cash received, bills due before the next receipt, and the business expected to support the following year's distribution. Writing these down makes the plan testable and adjustable. A prominent yield figure alone leaves that work unfinished.
Evidence and calculation notes
Sources were checked on October 6, 2026. Company figures use the consolidated annual and interim statements identified in the text, with accounting standards, attribution years and distribution status distinguished. Displayed amounts are rounded; calculations retain the underlying reported values. Figures 1 and 2 are hypothetical scenarios. Figures 3 and 4 redraw identified company disclosures. Community return screenshots are not treated as verified performance, and the article claims no personal holdings or achieved investment returns.
AI assisted with organizing sources and calculations; the text was checked and edited against the cited primary documents. Tax discussion is limited to the stated scope and actual treatment depends on applicable rules and settlement records. The companies illustrate dividend mechanics rather than personalized trading recommendations.