# The AI storage cycle: from four companies’ results to an SSD purchase
Canonical: https://growthyoung.com/blog/portable-ssd-interface-capacity-workflow?lang=en
Author: Strategy Research Lab (Independent Research)
Published: 2026-10-05
Updated: 2026-10-05
Use Micron, Sandisk, SK hynix and Samsung disclosures to distinguish volume, pricing and customer mix. Then connect the evidence to retail channels, capacity, transfer time and backup costs.
---
AI companies are building data centers. Why should that change the way you budget for an SSD? The answer passes through memory manufacturers, enterprise purchasing, channel inventory and your own files. This article puts four companies’ disclosures in context, examines how prices reach consumers, and works through capacity, waiting time and backup costs. The useful conclusion depends on what you need and when you will use it.
## 1. Start with numbers that answer different questions {#market}
A memory producer can report rising revenue while an enterprise SSD remains difficult to obtain, a computer maker trims its storage configurations, and a portable drive appears in a promotion. Those observations can coexist. They concern different products, customers and periods. Compressing them into a claim that AI has made all storage expensive removes the distinctions a buyer needs.
The following figures were publicly available by October 5, 2026. Currencies remain in their original units, and fiscal quarters follow each company’s calendar. This is an evidence table about business direction, not a market-share ranking. Revenue growth is not a substitute for shipment growth, and neither is automatically a measure of the price of a finished consumer drive.
| Company and reporting period | Selected disclosed figures | What the scope allows us to say |
| --- | --- | --- |
| Micron, fiscal Q4 2026, ended September 3 | NAND revenue: $14.1bn; sequential revenue approximately +42%, bits approximately +10%, pricing approximately +30% | Both volume and pricing contributed; this is Micron’s NAND business, not a retail SSD index |
| Sandisk, fiscal Q4 2026, announced August 5 | Datacenter revenue: $2.977bn versus $1.467bn in Q3; Consumer: $0.556bn versus $0.820bn | End markets inside one supplier can move in opposite directions |
| SK hynix, calendar Q2 2026 | Revenue: KRW79.3187tn, +51% sequentially | Consolidated results cover multiple memory products, not NAND alone |
| Samsung, calendar Q2 2026 | DS revenue: KRW127.5tn; operating profit: KRW89.2tn | DS includes memory, System LSI and foundry; these are not pure memory results |
Sources: [Micron prepared remarks, page 7](https://s25.q4cdn.com/621799436/files/doc_financials/2026/q4/Q4-FY26-Prepared-Remarks.pdf), [Sandisk results](https://investor.sandisk.com/news-releases/news-release-details/sandisk-reports-fiscal-fourth-quarter-2026-financial-results), [SK hynix results](https://news.skhynix.com/en/q2-2026-business-results/), and [Samsung results](https://news.samsung.com/global/samsung-electronics-announces-second-quarter-2026-results). SK hynix identifies its release as preliminary. These are issuer disclosures; this article has not independently audited the companies.
The interesting question is how demand is distributed. A stronger industry does not mean every end product is selling better. A company can grow overall while a consumer category shrinks. A buyer might encounter fewer promotions, fewer capacity options, or a particular series being discounted to clear stock. Aggregate growth does not tell us which of those outcomes applies to a specific order.
There are also three different meanings of selling more: more drives, more total capacity, and more revenue per unit of capacity. Moving from 1TB to 2TB products can increase bits without increasing drive count. Higher pricing can increase revenue without increasing bits. A revenue chart alone cannot distinguish those explanations, which makes it a poor shortcut for claims about how many devices consumers are buying.
For an individual, the sensible division of labor is straightforward. Company disclosures explain the purchasing environment. A record of the same model, capacity, seller conditions and warranty explains the price available to you. When channel information is missing, confidence in an industry narrative does not fill the gap. Keep the background signal and the transaction evidence separate until there is a reason to connect them.
## 2. Follow the workload through different storage layers {#layers}
A model exists as stored files and as an active workload. Persistent media holds its files; execution places relevant information in memory accessible to the computing hardware. Larger models can require more stored data. Longer requests and more simultaneous users can require more active state. Both types of capacity can grow, but they grow for different reasons and are purchased through different product families.
| Layer | Typical role | A purchasing mistake to avoid |
| --- | --- | --- |
| HBM, GDDR and system DRAM | Active weights, caches and working data, allocated according to hardware and software | Treating every kind of memory as one interchangeable pool |
| NAND and SSDs | Model files, datasets, persistent indexes, logs and backups | Assuming that more disk capacity adds graphics memory |
| Controllers, firmware and interfaces | Turning storage media into a usable, managed device | Comparing capacity while ignoring behavior and compatibility |
| Host and connection path | Moving data between devices | Inferring protocol from connector shape or aggregate bandwidth from port count |
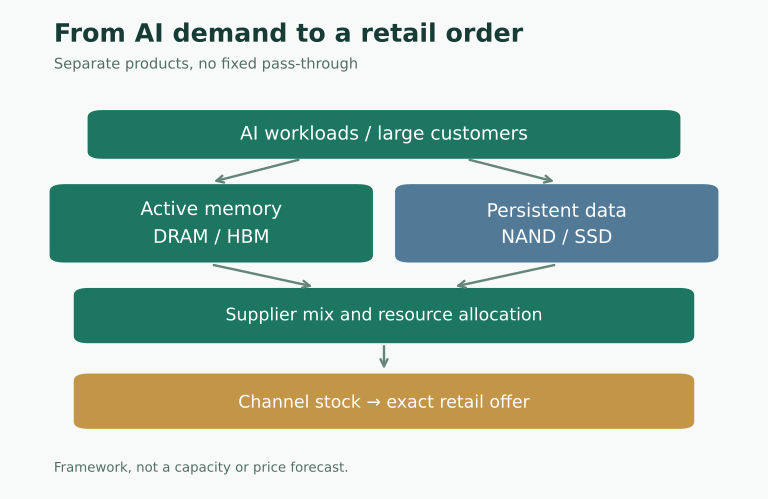
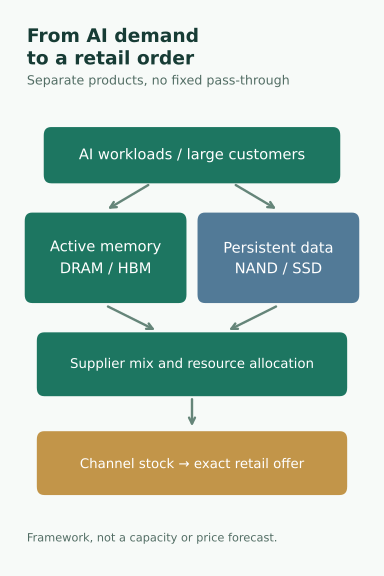
HBM belongs to the DRAM family; NAND is a different product. Saying that HBM has consumed the flash destined for your SSD gives the reader the wrong physical picture. Nor should we assume that a NAND production line can immediately and costlessly become an HBM line. The more useful connection is economic: large customers can increase demand across several layers while suppliers allocate investment, engineering effort and customer commitments.
Figure 1. An analytical framework. Arrows identify relationships to investigate, not interchangeable fabrication capacity or fixed price pass-through.
Enterprise buyers may pay for behavior a particular home user does not need: predictable service under sustained load, management capabilities, endurance conditions and a qualified platform combination. Identical capacity labels do not make two products equivalent. Enterprise order values therefore cannot be converted into portable-drive costs without looking at product mix and the features being purchased.
The reverse mistake is importing every enterprise requirement into a personal shopping list. Someone making a weekly backup and someone continuously writing large working files need different evidence beyond capacity. Advice for the latter can inflate the former’s budget without improving the result. A feature deserves a place in the budget when the workload makes it relevant.
The lifecycle of data is another part of the industry story. Raw material, cleaned versions, indexes, model copies, outputs and backups can each occupy space. Buying more storage is one response; reducing unnecessary duplication is another. The same amount of AI use can produce very different storage spending depending on retention rules. A hardware-only analysis misses that source of demand flexibility.
## 3. Customer mix is more informative than a claim of strong demand {#mix}
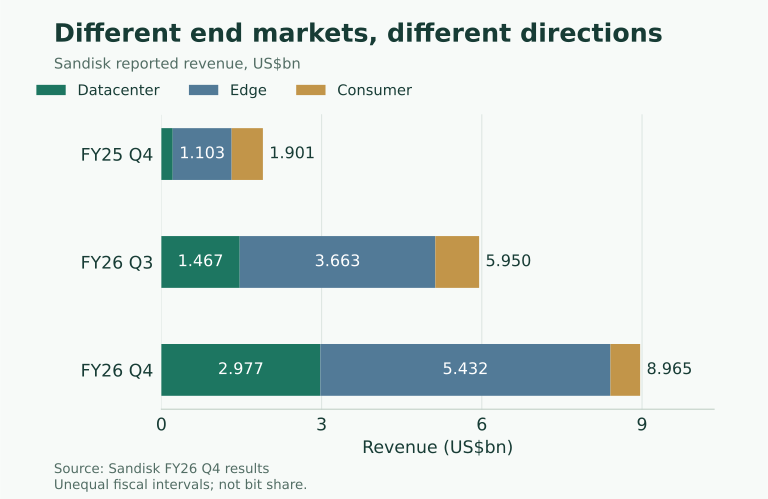
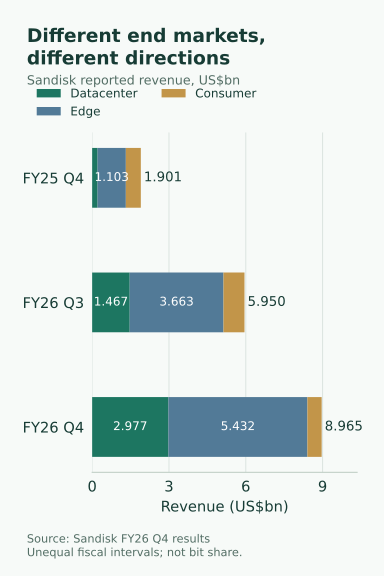
Comparing end markets inside one company avoids some of the problems of comparing consolidated companies across currencies and accounting scopes. The chart below uses Sandisk’s own Datacenter, Edge and Consumer categories. Edge is not relabeled as retail, and Consumer is not presented as the entire global consumer market. The periods are intentionally identified because the intervals between them are unequal.
Figure 2. Reported revenue, US$bn. Total revenue was 1.901, 5.950 and 8.965 respectively. Reconstructed from the Sandisk release cited above; this is not a bit-shipment chart.
Datacenter’s share of company revenue rises from 0.213/1.901, approximately 11.2%, to 2.977/8.965, approximately 33.2%. Those are calculations using disclosed dollar values. They describe revenue mix, not bit share and not Sandisk’s share of the worldwide enterprise SSD market. The distinction matters because prices and product composition can change the ratio even when underlying quantities behave differently.
The commercial question this raises is specific: when customers want supply at the same time, which orders does a manufacturer prioritize? Current pricing is only one consideration. Qualification work, future contracts and product strategy may also matter. My inference is that rising enterprise importance makes consumer supply and channel choice worth monitoring more closely. The chart does not quantify how many retail drives will be available.
Consumer revenue declining also requires restraint. Unit volume, pricing, channel purchasing cadence, product composition and internal resource allocation can all contribute. If a release does not separately quantify each driver, selecting one explanation and calling it proven goes beyond the evidence. A single company’s quarterly decline certainly cannot establish that ordinary users no longer need storage.
Samsung’s discussion of server strength alongside softer parts of mobile and PC demand, and SK hynix’s discussion of higher-value products, are compatible with this picture of divergence. They do not create a uniform portable-drive forecast. Similar language across suppliers is a reason to investigate the mechanism, not permission to drop the definitions that make their numbers meaningful.
For a purchaser, waiting for the whole industry to become normal is therefore an imprecise plan. Your target model may already have reliable availability while another category remains constrained. A better waiting condition is observable: the required capacity returns to stock, two dependable sellers offer the right warranty, or repeated quotations reach an acceptable total price.
## 4. Revenue growth contains both volume and price {#price}
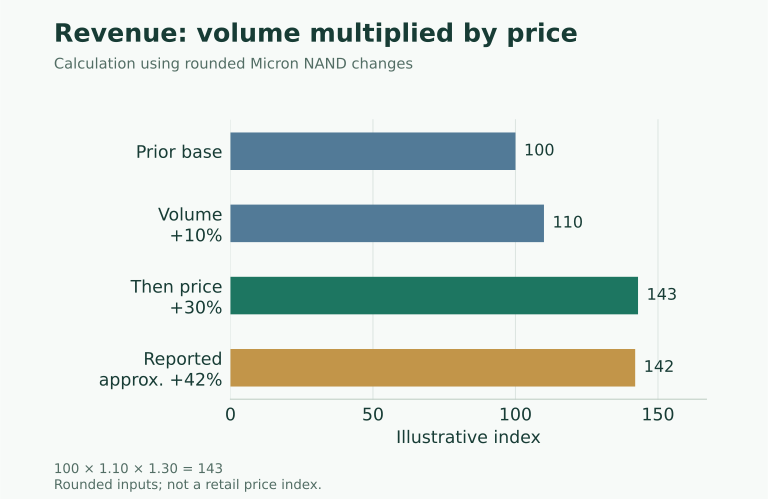
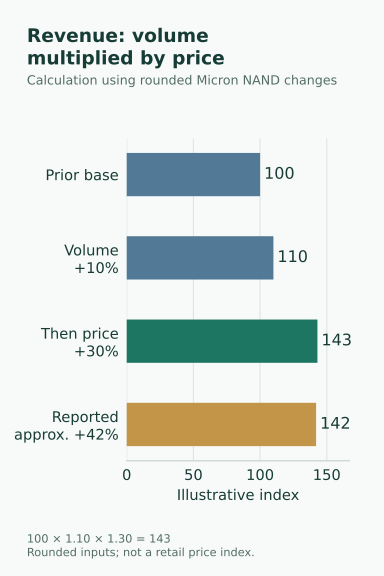
Micron’s NAND disclosure offers a useful arithmetic exercise. Approximately 10% more bits and approximately 30% higher pricing produce 1.10 × 1.30 = 1.43, or around 43% more revenue in a simplified calculation. The disclosed increase is around 42%. The small difference is a reminder that the inputs are approximate and that product composition and price measurement require more detail; it is not evidence of an accounting error.
Figure 3. A calculation using rounded Micron growth rates. The base of 100 is invented for illustration; 143 is calculated and 142 reflects the reported approximate increase. Neither is a retail price index.
Adding 10% and 30% misses the fact that the additional volume also sells at the new price. More importantly, the exercise prevents a different error: explaining all revenue growth as additional devices purchased. A price-led expansion and a volume-led expansion can respond differently when demand weakens. Knowing that distinction is useful even if you have no interest in forecasting a company’s earnings.
There are several stages between supplier pricing and a retail order. Contracts can reset on different schedules. Channel stock can have different acquisition costs. A finished product includes components and services beyond flash. Sellers can change promotions and margins in response to competing products and their own inventory needs. Each stage can delay, soften or otherwise change the relationship.
Consider a deliberately hypothetical product whose original cost is 60% flash. If that flash input rises 20% and all other costs stay constant, total cost rises 12%. This is not a bill of materials for any actual SSD, and it excludes changes in margin and taxes. It simply demonstrates why an input-price increase is not automatically a finished-product price increase. Without real cost composition, an exact pass-through coefficient would be false precision.
| Number being cited | Conditions to check | Number it cannot replace |
| --- | --- | --- |
| A supplier’s NAND pricing change | Product mix, period and measurement definition | The checkout-price change for a specific portable drive |
| A contract-price forecast | Publication date, product coverage and forecast period | A price increase that has already happened |
| A retailer’s advertised price | Seller, stock, coupon, taxes and warranty region | A repeatable final transaction price |
| A purchase screenshot | Model revision, purchase date and transaction conditions | A representative long-term price series |
On September 30, TrendForce forecast fourth-quarter conventional DRAM contract-price increases of 10–15% sequentially and NAND increases of 15–20%, while distinguishing client inventory from enterprise demand. These are dated forecasts. Conventional DRAM should not be silently expanded into an index that includes all HBM. [TrendForce’s original release](https://www.trendforce.com/presscenter/news/20260930-13258.html).
At this article’s publication date, the calendar fourth quarter has only just begun. Reporting that forecast as a completed 20% increase would get the timing wrong. Even if the forecast proves accurate, its upper bound cannot stand in for every product. A reader should know which kind of evidence is being used and what future information could require a different conclusion.
## 5. Investment spending and available products run on different clocks
Micron disclosed fiscal 2026 net capital expenditure of $27.37bn. Spending, however, does not have a single conversion date into saleable output. Equipment purchases, construction, technology transitions and qualified output of a particular product represent different steps. [Micron’s annual results](https://investors.micron.com/news/press-release/2026/Micron-Technology-Inc--Reports-Record-Fiscal-Fourth-Quarter-and-Full-Year-2026-Results/default.aspx).
The purchasing question is when investment produces the product you need, in what quantity, and how much of that output already corresponds to other commitments. A large investment headline answers only part of the first step. Equipment reaching a building does not mean all specifications immediately ship in stable volumes. Product qualification and conversion costs remain relevant.
You do not need an exact industry turning-point forecast to make use of this. Keep two possibilities open. Supply may grow while demand absorbs the increase, preserving pressure. Alternatively, purchasing may slow and inventory may be released, allowing some end-market prices to soften first. Both paths are consistent with capacity expansion; demand, timing and inventory distinguish them.
An individual cannot control those variables but can set a purchasing deadline. A project due in two weeks calls for a comparison of solutions that arrive in time. A speculative project six months away leaves more room to preserve optionality. Translating industrial uncertainty into a personal budget often depends more on the cost of waiting a month than on a confident prediction of global average prices.
### Keep three budgets separate
The manufacturer’s investment budget, a reseller’s inventory budget and your equipment budget have different purposes. A supplier may value future production capability, a reseller may value moving stock before a product transition, and you may value completing a project this week. All three can make rational decisions at different prices. There is no requirement that a good decision for one participant should be copied by the others.
This is also why a profitable supplier does not prove that every retailer earns a large margin. Product mix, purchasing terms, returns and service costs sit between the two. A consolidated corporate margin is not a retailer’s markup. Conversely, a temporary discount does not prove that the supplier’s demand story has collapsed. An analysis should explain which participant’s economics it is actually measuring.
The useful discipline is to write a separate question for each budget. What expands qualified supply? What clears or replenishes channel stock? What completes my work at acceptable cost? If one source answers only the first, do not use it as the complete answer to the third. This separation turns a broad industry story into a set of testable relationships.
## 6. Build capacity around the lifecycle of your files {#capacity}
Before counting gigabytes, divide files by what happens if they disappear. Some original material cannot be recreated. Some intermediate results can be regenerated at a time cost. Public model files may be downloadable again, subject to availability and version control. They all occupy space, but they need not have identical retention periods or backup treatment.
Here is an illustrative working set, not a minimum specification for a particular model or person. Temporary space is separate because the peak can occur during conversion, extraction or the coexistence of old and new versions. The final archived project may be much smaller than the capacity required to produce it safely.
| File category | Illustrative capacity | Management decision |
| --- | --- | --- |
| Active models and necessary versions | 150GB | Record versions and checksums; remove clearly unused copies |
| Original documents and media | 250GB | Establish independent backup before moving cold material |
| Outputs and working copies | 100GB | Retain reproduction steps and set rules for obsolete versions |
| Temporary work and near-term growth | 150GB | Check peak requirements before batch imports |
| Total | 650GB | Still account for system use and future change |
A nominal 1TB is 10¹² bytes, approximately 931.3GiB. The difference is a unit conversion, not roughly 69GB that a manufacturer failed to deliver. Filesystem and system use can further reduce available capacity. Keep units consistent in the budget, especially when comparing operating-system displays with product labels.
The 650GB example does not automatically require 2TB, and it does not prove that 1TB will always suffice. Growth and migration costs decide the next step. Another 400GB expected within six months creates a concrete reason to compare the larger option. A collection of unused model downloads may instead justify a better retention rule.
Primary capacity is also not backup capacity. Two folders on one device do not cover loss or failure of that device. Prioritize independent copies of material that cannot easily be recovered. For downloadable models, a full second copy may or may not be worth keeping, depending on network conditions, version availability and the time required to recreate the environment.
Cost per terabyte remains useful, but the invoice should include an enclosure where needed, suitable cables, the backup destination and migration effort. Two options with the same nominal capacity price can have different usable costs if one already includes the components needed for the job. Leaving those additions outside the comparison favors the incomplete quote.
### Buy a complete working arrangement
Compare complete configurations before comparing labels. A bare internal drive, a drive installed in an enclosure and an assembled portable product solve overlapping but different purchasing problems. Establish which parts are included, who supports the combination and what happens if a fault cannot immediately be assigned to the drive or enclosure. Support boundaries matter most when the equipment is needed for a deadline.
Warranty should be recorded as an actual set of conditions: seller, region, covered product, proof of purchase and the process for a claim. A warranty term does not mean that data recovery is included. Keep the recovery plan separate from the replacement plan. Replacing a device and recovering an irreplaceable project are different outcomes, even when both follow the same failure.
Avoid treating product-family names as full specifications. Capacity variants, revisions and bundled cables can affect the comparison. Save the exact model identifier and the documentation attached to the offer. This makes a future support request easier and prevents an apparent price reduction from concealing a changed product or warranty arrangement.
## 7. The value of speed depends on how often you wait {#speed}
Samsung’s T7 provides a concrete specification example: USB 3.2 Gen 2 and sequential read/write ratings up to 1050/1000MB/s, with host, cable and UASP conditions. These are manufacturer specifications, not measurements conducted for this article or a claim that this model is the best current purchase. [Samsung specifications and conditions](https://www.samsung.com/ca/memory-storage/portable-ssd/portable-ssd-t7-usb-3-2-2tb-blue-mu-pc2t0h-am/).
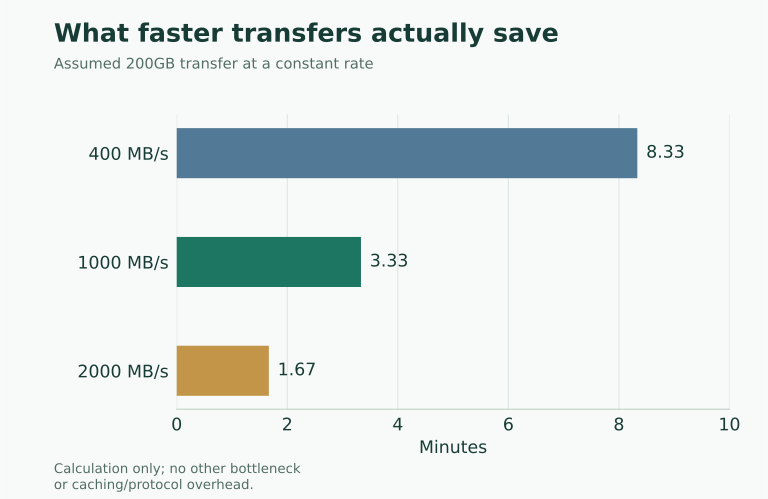
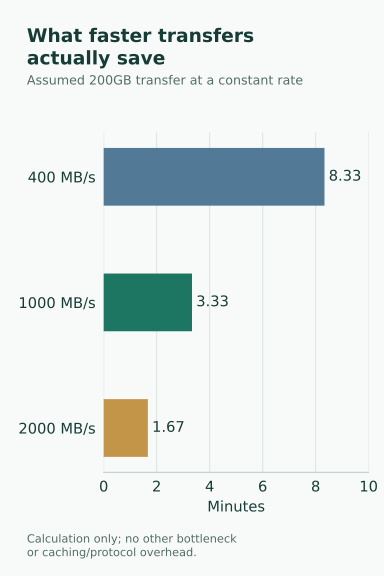
Simple division provides an initial scale for the benefit. Assume a continuous 200GB transfer, no other source or destination bottleneck, and a constant speed throughout. Real copies depend on file count, direction, caching, temperature and competing work. The following is a ruler for interpreting a claim, not a promise of achieved performance.
| Assumed sustained throughput | Ideal time for 200GB | Saving versus 400MB/s |
| --- | --- | --- |
| 400MB/s | 500 seconds, or 8.33 minutes | None |
| 1000MB/s | 200 seconds, or 3.33 minutes | 5 minutes |
| 2000MB/s | 100 seconds, or 1.67 minutes | 6.67 minutes |
Figure 4. Illustrative calculation using decimal GB and MB. Time equals 200,000MB divided by sustained throughput. No protocol overhead or product benchmark is assumed.
Suppose a faster complete setup costs an additional RMB600 and genuinely saves five minutes on each of 220 working days. That is about 18.3 hours a year, or approximately RMB32.7 of equipment premium per hour saved. This translates a premium into time; it does not establish income. If the copy finishes unattended during lunch, less elapsed time may not create usable working time.
If the same transfer happens twenty times a year, five minutes each totals only about 1.67 hours. The same RMB600 premium becomes roughly RMB360 per hour saved. The equipment is unchanged; the user’s workload changes the conclusion. Asking how often a particular wait occurs is more useful than asking whether fast drives are universally worth buying.
Find the limiting part of the path before spending. The host port, dock uplink, cable, enclosure and media can each matter. USB-C identifies a connector shape, not a guaranteed data rate, and a power marking cannot replace a data specification. [USB-IF cable information](https://compliance.usb.org/index.asp?Format=Standard&UpdateFile=Cables+and+Connectors). If a direct connection already meets the requirement, replacing the entire setup may be unnecessary.
When assessing someone else’s measurement, ask for file sizes, file count, transfer direction, free capacity, connection and duration. A short benchmark and a long write answer different questions. A claim of full speed without those conditions does not establish behavior in your workflow or support a dependable brand ranking.
## 8. Three situations lead to three purchasing sequences {#decision}
**Mostly cloud AI, with a browser and local documents.** Start by inspecting actual file growth. Distinguish original material from caches and duplicate synchronized copies. If usable space is sufficient, data-center procurement news is not a reason to stockpile drives. Independent backup, a reliable connection or better retention rules may provide more value. Change that conclusion when a persistent space deficit appears after sensible cleanup.
**Local model experimentation, with frequent downloads and conversions.** Confirm that working memory can support the intended model and context before expanding the model collection. Being able to store ten large models does not establish that the computer can run any particular one. If repeated loading dominates the work, a faster working drive may help. If the model stays resident and generation is slow, examine computing and memory paths. The companion article develops [the local-AI upgrade budget](/blog/usb-c-hub-display-compatibility?lang=en).
**Daily large media work with a firm deadline.** Establish independent backup, then compare a safe copy of the actual file set through a direct connection and the dock. If waiting blocks productive work, count how often it happens and calculate the value of the bandwidth upgrade. If errors, disconnects or unusual heat accompany the slowdown, preserve important data and investigate before interpreting a more expensive drive as the solution.
None of these sequences requires predicting the lowest price. They require a date, a capacity requirement, a performance requirement and a cost of failure. One reader may buy now, another may wait, and another may improve the workflow without buying. Industry analysis is useful when it gives those choices reasons instead of directing every reader toward the same product link.
## 9. Write down what would change your decision {#evidence}
A purchasing note should include conditions that could reverse the conclusion. If every new observation is interpreted as another reason to buy, the exercise has stopped testing a decision. It has become a search for support. Explicit revision conditions help separate a practical plan from a story that cannot be wrong.
| Working judgment | Evidence to keep watching | A reason to change action |
| --- | --- | --- |
| Upstream pressure may reach the target product | Comparable quotations for the exact model and warranty | Stable pricing and ample supply reduce urgency |
| Waiting may save money | Deadline, stock and real promotions | Delay costs exceed a plausible price saving |
| A faster interface will save time | Direct-connection tests of the actual workload | The bottleneck is elsewhere, so cancel the interface upgrade |
| More capacity is economical | File growth, retention and migration frequency | New space would stay idle, favoring cleanup or tiering |
| Enterprise demand changes supplier priorities | Subsequent segment disclosures and availability | Reversed purchasing or inventory trends require a new explanation |
The log does not have to be updated daily. Without a near-term deadline, checking comparable quotations every few weeks can be more useful than reading dozens of headlines. Increase the frequency as delivery approaches. Record date, seller, full model, capacity, total cost and warranty conditions so that a changed bundle or seller is not misread as a price move.
If personal observations become a public price article, retain the sampling method. Explain why those models were chosen, whether prices were captured only when stock was available and whether a coupon could be used repeatedly. A polished curve without this information can turn promotional noise into a misleading market narrative. This article has no continuous retail-price sample and therefore offers neither a retail turning-point claim nor a model-specific inflation figure.
The useful final artifact is a purchasing brief: how much usable space is missing, which files need another copy, what waiting interrupts work, when the problem must be solved and the maximum acceptable cost. Company reports explain the environment; your records determine the action. Connecting those two levels makes it possible to understand the AI storage cycle without paying for every alarming headline.
## Sources and method
Evidence checked October 5, 2026. This is public-source research and scenario analysis, without hardware tests or continuous retail-price tracking. Figure 1 is a framework, Figure 2 redraws disclosed figures, and Figures 3–4 are reproducible calculations. Company statements and third-party forecasts can change; the corporate data are not a securities recommendation.
- Company evidence: [Micron remarks](https://s25.q4cdn.com/621799436/files/doc_financials/2026/q4/Q4-FY26-Prepared-Remarks.pdf), [Micron annual results](https://investors.micron.com/news/press-release/2026/Micron-Technology-Inc--Reports-Record-Fiscal-Fourth-Quarter-and-Full-Year-2026-Results/default.aspx), [Sandisk results](https://investor.sandisk.com/news-releases/news-release-details/sandisk-reports-fiscal-fourth-quarter-2026-financial-results), [SK hynix results](https://news.skhynix.com/en/q2-2026-business-results/), [Samsung results](https://news.samsung.com/global/samsung-electronics-announces-second-quarter-2026-results).
- Industry and product context: [TrendForce forecast](https://www.trendforce.com/presscenter/news/20260930-13258.html), [Samsung T7 specifications](https://www.samsung.com/ca/memory-storage/portable-ssd/portable-ssd-t7-usb-3-2-2tb-blue-mu-pc2t0h-am/), [USB-IF cable information](https://compliance.usb.org/index.asp?Format=Standard&UpdateFile=Cables+and+Connectors).
- Reading time is estimated from the English prose at approximately 200 words per minute. Checking charts and reproducing calculations takes additional time.