At 11:30 a.m., the ChiNext index was below 3,000 and more than 4,300 stocks were down. At 3 p.m., the three headline indexes closed slightly higher. A screenshot of the close makes October 9 look uneventful. An investor holding AI hardware may remember a very different day. The interesting part is not how much the indexes gained; it is the distance between the intraday reversal, the sector split, and what was actually known about policy.
The move from 11:30 a.m. to 3 p.m.
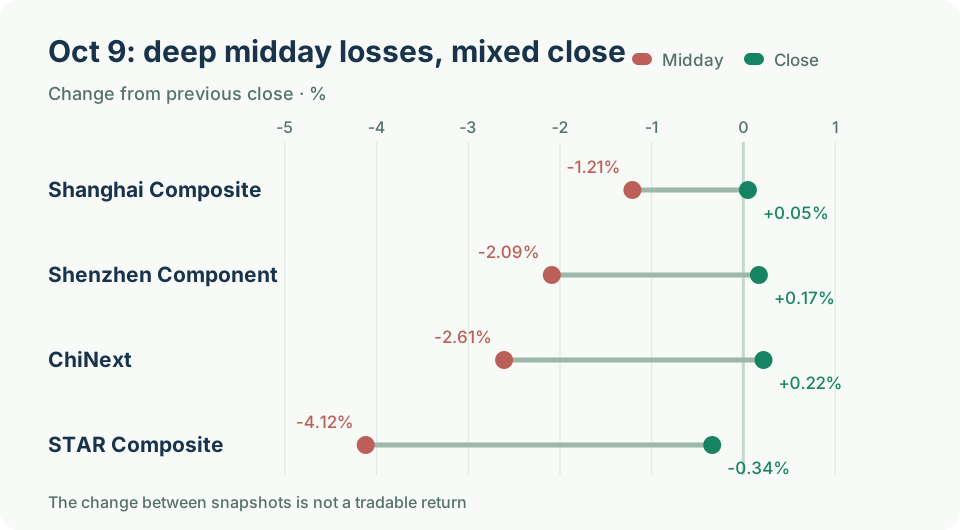
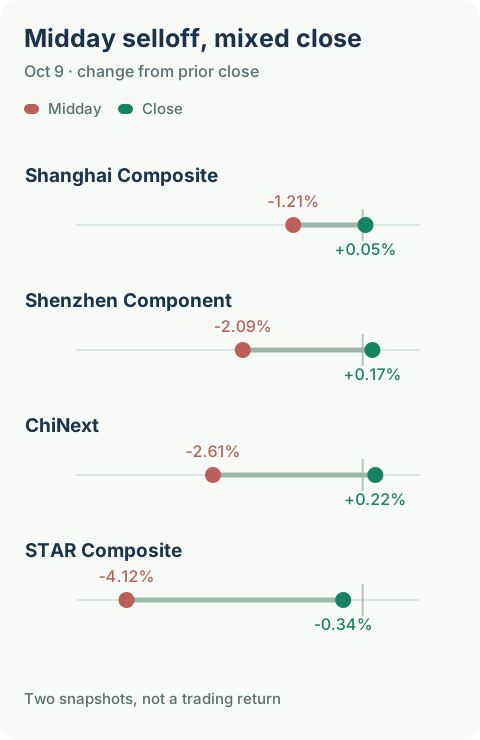
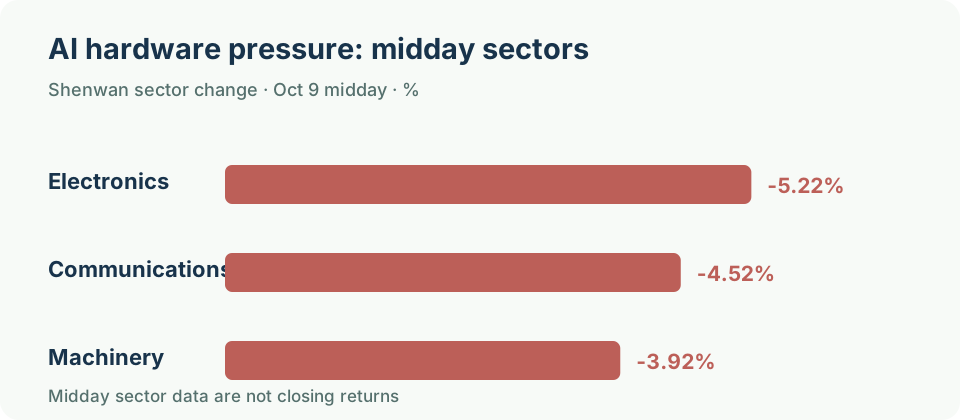
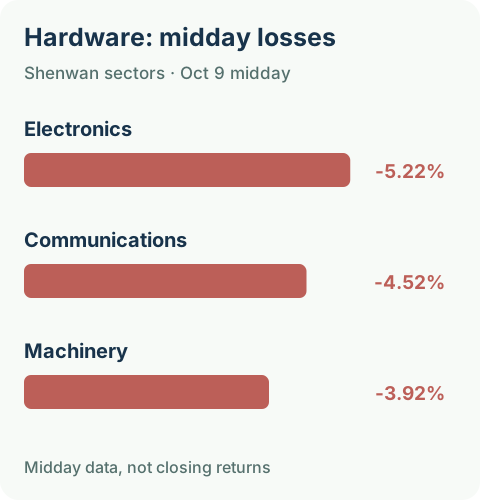
Fix the timestamps before telling a market story. At the midday break, Securities Times DataBao reported that the Shanghai Composite was down 1.21%. In the same midday snapshot, the Shenwan electronics, communications and machinery sectors were down 5.22%, 4.52% and 3.92%. China National Radio Finance reported the Shenzhen Component down 2.09%, ChiNext down 2.61%, and the STAR Composite down 4.12%. It also reported more than 4,300 declining stocks across the market. These are midday observations, not the day's lows or closing figures.
At the close, Yicai reported the Shanghai Composite at 3,813.79, up 0.05%; Shenzhen Component at 12,641.86, up 0.17%; and ChiNext at 3,043.33, up 0.22%. The STAR Composite still closed down 0.34%. Because each published percentage is measured against the same previous close, the reported reading rose by 1.26, 2.26 and 2.83 percentage points for the three main indexes between midday and close. Those differences are not the returns an investor could have earned by buying at noon.
| Index | Midday | Close | Change in the quoted reading |
|---|---|---|---|
| Shanghai Composite | −1.21% | +0.05% | +1.26 percentage points |
| Shenzhen Component | −2.09% | +0.17% | +2.26 percentage points |
| ChiNext | −2.61% | +0.22% | +2.83 percentage points |
| STAR Composite | −4.12% | −0.34% | +3.78 percentage points |
This is the first trap in a one-line recap. A large recovery from midday and a strong close are different claims. The STAR Composite made the largest improvement in its quoted percentage yet remained negative for the day. Shanghai turned green but gained just 0.05%. One afternoon does not establish a new uptrend; the bleak midday snapshot, by itself, misses a real change in demand later in the session.
RMB 1.9 trillion traded. What actually rose?
According to The Paper's closing report, turnover on the Shanghai and Shenzhen exchanges was RMB 1,900.6 billion, up from RMB 1,682.1 billion on the previous trading day. The increase was RMB 218.5 billion, or about 13.0% using the previous day as the base. Turnover measures completed transactions involving both buyers and sellers. It is not a net inflow of RMB 218.5 billion, and a single day's extra trading does not prove that long-term capital will continue to arrive.
The same report cites Wind's closing count across Shanghai, Shenzhen and Beijing: 3,294 stocks up, 2,140 down and 131 unchanged. Among stocks that moved either up or down, 60.6% were up. Including unchanged stocks in the denominator gives 59.2%. Both numbers are valid, but they answer slightly different questions. The midday statement that over 4,300 stocks were down was recorded at another time and may use a different universe. Subtracting it directly from the closing count would create a false measure of “afternoon turnarounds.”
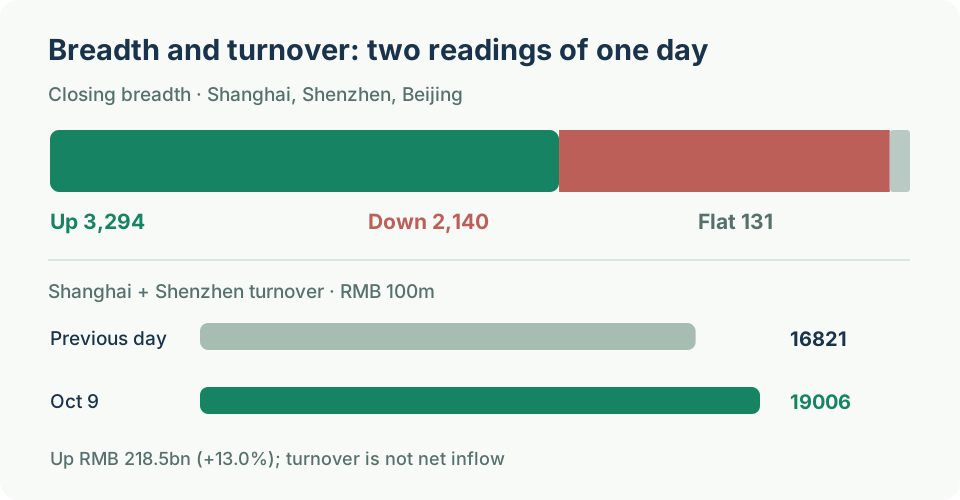
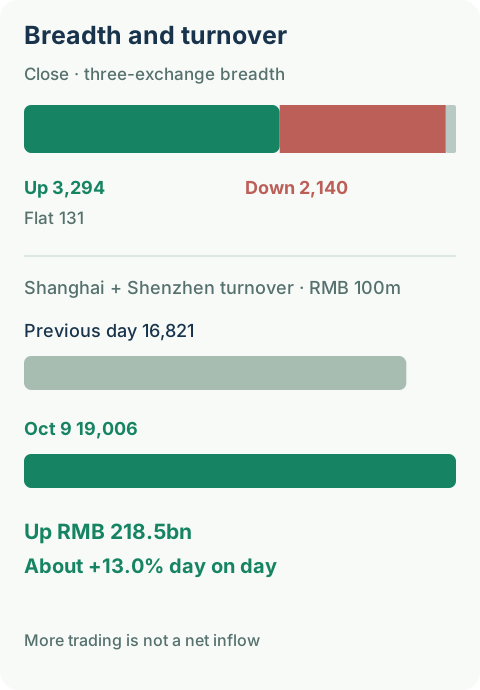
The defensible conclusion is modest: more stocks rose than fell at the close, and trading became more active; the main indexes gained very little, while the STAR Composite still fell. Breadth counts names roughly equally. Indexes use their own weighting and inclusion rules. Large stocks or concentrated weak sectors can offset many smaller winners. Today's figures suggest such a split, but we do not have a stock-by-stock index contribution file that would attribute the exact effect to individual constituents.
“About six in ten stocks were up, so making money was easy” is also an account-level error. Your holdings, entry prices and any sale during the selloff matter. A green closing breadth reading says where stocks finished relative to the previous close, not whether an actual investor made a profit.
The weak part of tech was specific
Technology was not one synchronized trade. The most striking early losses were in hardware. DataBao's Shenwan sector figures put electronics down 5.22% and communications down 4.52% at midday. Yicai's closing account said parts of the semiconductor and computing-hardware chain, including components, MLCC, lithography and CPO themes, were still weak. The STAR Composite's −0.34% close is a direct counterexample to “the three headline indexes recovered, therefore tech recovered.”
Applications and content moved differently. Yicai described cultural media and cinema as leaders, with precious metals, agriculture, retail and software development also relatively strong. The Paper reported strong media names and an afternoon rise in broker shares. A media business depends on content, distribution, advertising and paying audiences. PCB, optical modules and semiconductor equipment depend on orders, manufacturing capacity, customer qualification and gross margins. Calling both “AI stocks” and then declaring that AI as a whole fell and recovered erases the division visible on this day.
| What investors saw | What the reports establish | What they do not establish |
|---|---|---|
| AI hardware | Midday electronics and communications losses; weakness in several hardware themes at the close | That orders throughout the AI chain have already deteriorated |
| Applications and content | Strength in media, cinema and some software names | That AI applications have achieved dependable profits |
| Indexes | Tiny gains in three major indexes; a loss in the STAR Composite | That the tech correction has ended |
| Turnover | About RMB 1.9 trillion on Shanghai and Shenzhen, 13% more than the prior day | That every additional yuan was new long-term capital |
A careful reading is that investors priced different tech stories differently. Even “repricing” is only a framework. To distinguish worsening fundamentals, a valuation reset, crowded-position unwinding and policy anxiety, one needs order books, company results, official rules and subsequent market behavior. A single daily candle cannot identify one exclusive cause.
China has published plans; the US has a real rate move and a policy scenario
Evidence must be ranked before it is used. On September 28, China's Ministry of Industry and Information Technology and six other departments published a Fifteenth Five-Year Plan for new battery industries. On September 11, the ministry explained its “AI plus software” program, emphasizing software products, services and adoption. These are published industrial directions. They help explain why battery and software application shares can be considered separately from AI hardware. They do not guarantee earnings or a rise on October 9.
In the United States, one macro policy change has occurred: on September 16, the Federal Reserve raised the federal funds target range by 25 basis points to 3.75%–4.00%. A higher dollar risk-free rate can affect the discount rate applied to growth assets and global risk appetite. That is an economic mechanism, not proof that a particular Chinese stock fell a specific amount because of the Fed. Quantification would require matched observations for Treasury yields, exchange rates, earnings expectations, valuations and positioning.
Another discussion concerns possible US limits on Chinese optical modules or components. National Business Daily's October 8 interviews and company responses describe a broker's scenario for potential FCC measures, not a final rule. The interviewed companies also stressed uncertainty about the information and its impact. Yicai's coverage likewise calls the measures potential. This article does not treat the scenario as an enacted US ban. Traders can price uncertainty before a rule exists; the affected products, effective date and financial exposure still need official text and company disclosures.
| Signal | Evidence status on October 9 | Reasonable use in a market recap |
|---|---|---|
| China's battery plan | Formally published by ministries | Medium-term background, not a guarantee of today's return |
| China's AI plus software program | Published and explained by a ministry | Shows an application-side direction, not realized profits |
| September Fed hike | Announced and implemented | Global financing and valuation background, not a stock-specific cause |
| Potential US optical-module limits | Reported broker scenario and company responses | Shows uncertainty being traded, not an enacted regulation |
Three possible stories, each with a way to test it
External policy and rates. If this dominates, companies with greater actual exposure to US optical customers should respond differently once a rule or customer purchasing change is documented. One should compare their disclosed revenue and product mix, not apply a sector-wide loss estimate. Where there is no final rule and many shares decline together, sentiment or positioning may be involved too. We do not have the firm-level order and geographic revenue detail to estimate a policy cost here.
Crowded positions and valuation. If many investors own the same expensive hardware names, a small shift in expected growth can cause a synchronized sale. Yicai's interviews discuss fund positioning and profit-taking and cite a rise in active-fund exposure to upstream AI materials in the second quarter. That is a reported interpretation, not a transaction-level attribution of the whole market. Later fund disclosures, turnover concentration and the price response to genuine order news would help test it.
Rotation within the industrial chain. Content, software, batteries and hardware carry different cash-flow risks. Chinese policy supports medium-term application and industrial development. The US optical restriction scenario concerns specific hardware products. Money flowing toward media, batteries or retail on the same day does not require a claim that “technology as a whole has been abandoned.” A counterexample could arrive quickly: better-than-expected hardware orders or the absence of a formal US restriction might correct excessive pessimism. Conversely, application companies that cannot convert users and policy support into cash flow may give back a one-day rally.
All three stories could coexist, but today's closing data cannot assign each a reliable share of causation. Prices trade expectations before facts arrive. For a researcher, the useful record is what new evidence would change the view, not an elegant single-cause explanation.
A short checklist for the next trading day
| Record together | What it might reveal | Common misreading |
|---|---|---|
| Closes of the three major indexes, STAR and sector indexes | Whether the rebound broadens beyond a few groups | One day of breadth is not an established trend |
| Electronics, communications and media turnover and breadth | Whether rotation continues | Turnover is not net buying |
| Optical companies' filings, customer orders and official US rules | Whether a scenario becomes an enforceable constraint | A broker note is not a regulation |
| Chinese implementation details and company quarterly results | Whether industrial policy reaches orders and profit | Policy direction is not company earnings |
| Same-day US yields, exchange rates and valuations | Whether external costs and local prices move together | Correlation alone is not causation |
As of the October 9, 2026 close, the observable event was a substantial afternoon reversal: the three main indexes moved from losses of more than 1%–2% at midday to tiny closing gains. Turnover rose, and more stocks finished up than down. At the same time, the STAR Composite and AI hardware themes showed continuing pressure. Chinese industrial plans and the US rate hike are published policy facts. A potential optical-module restriction remains a scenario requiring confirmation. The apparent mystery of the A-share day becomes less mysterious when indexes, sectors, personal portfolios and the evidence behind each headline are kept on separate clocks.
Data boundary and sources
This is a public-source recap written after the close. It does not use tick-by-tick trades, investor accounts or a reproducible measure of sector fund flows. Midday index and industry data come from Securities Times DataBao and China National Radio Finance. Closing indexes and sector descriptions come from Yicai; turnover and three-exchange breadth come from The Paper. Media and data vendors may have slightly different scopes. Derived figures are calculated only where the comparison is compatible. Policy links appear beside the claims above. Sources were checked on October 9, 2026. This is research commentary, not investment advice; later filings, trading and data revisions may change the reading.