An annual dividend can make bank shares feel easy to hold. But how long might the wait be, and how much could the account lose along the way? This historical scenario starts with RMB 500,000 and adds money under fixed rules, eventually accumulating stock and cash. It also falls nearly 40 percent from its high and takes more than two years to recover. First we will unpack the account, then examine whether bank capital, ownership, and valuation support the case for holding.
Define the core-holding claim before judging it
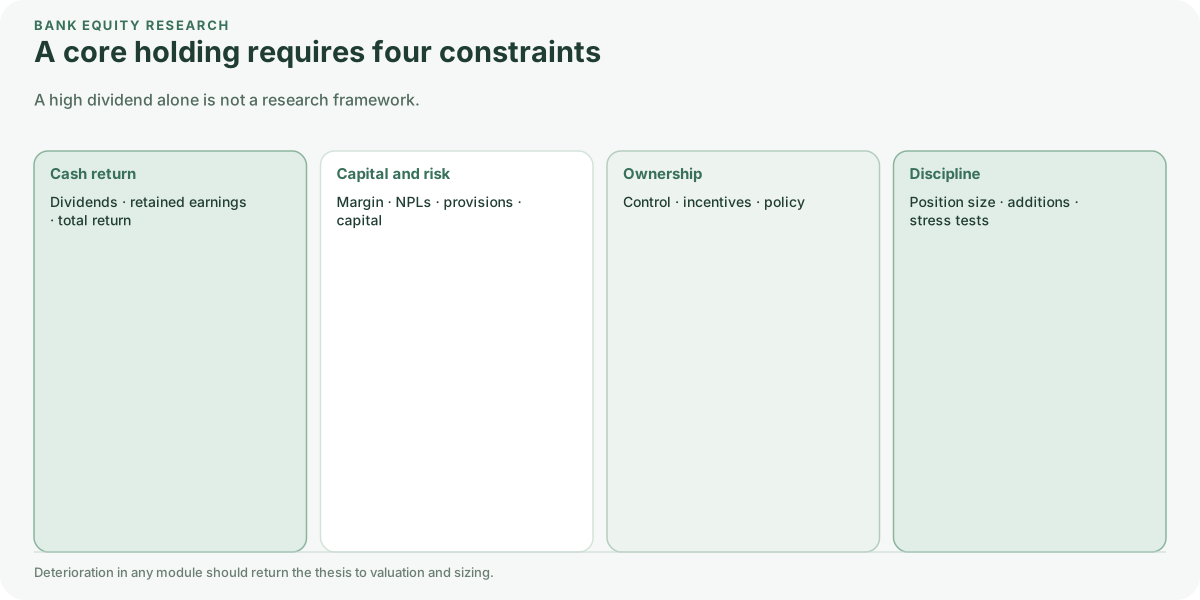
Here, a “core holding” is neither a trading basket for predicting short-term moves nor a concentrated industry bet. It is an equity position intended for low-turnover, long-duration ownership while remaining subject to continuing risk review. The case for putting banks in that role is that they remain central to household saving, business finance, and payment clearing; mature banks regularly disclose profits, capital, and distribution policy; and their ownership and regulatory structures make risks open to inspection. None of this means the state protects every common shareholder from loss.
At the end of the fourth quarter of 2025, China’s banking financial institutions reported RMB 480 trillion in assets. Commercial banks reported a 1.50 percent non-performing loan ratio, 205.21 percent provision coverage, and a 15.46 percent capital adequacy ratio, while net interest margin had fallen to 1.42 percent. The sound reading is that capital buffers remained and margin pressure was real. The asset total and the four ratios do not use identical reporting populations, and industry averages cannot substitute for analysis of one bank. See the National Financial Regulatory Administration indicators republished by the China Banking Association.
The ten securities below are therefore a fixed research sample that was tradable in 2015, not a current top-ten list or a recommendation: ICBC (601398), China Construction Bank (601939), Agricultural Bank of China (601288), Bank of China (601988), Bank of Communications (601328), China Merchants Bank (600036), Industrial Bank (601166), Ping An Bank (000001), Bank of Ningbo (002142), and Bank of Nanjing (601009). The set includes large state banks, joint-stock banks, and city commercial banks so that different funding structures, regional exposures, and governance are not compressed into one “bank” label.
The results require that caution. From January 5, 2015 to September 4, 2026, the ten securities’ pretax dividend-reinvestment total-return indices ended between 1.44 and 4.52, a ratio of roughly 3.13 between the highest and lowest. Those indices reinvest dividends at the ex-date close. The portfolio account later in the article retains dividends as cash, so the two measures must not be mixed. Industry diversification reduces dependence on one bank; it does not make earnings quality, capital consumption, or governance identical. An industry average conceals the selection risk an investor actually carries.

A dividend is cash flow, not total return
Dividends are one part of a shareholder’s return. Retained profit stays inside the bank; whether it produces more value depends on how well that capital is used. Changing expectations for asset quality and interest rates also move the share price. The same dividend yield can therefore reflect very different conditions: a cheap valuation, slow growth, rising risk, or an unusually large payout in one year.
Net interest margin illustrates the tension. The People’s Bank of China’s first-quarter 2025 monetary-policy report discussed rates, credit delivery, and financial-institution operations within one macro framework. Investors should treat margin, funding cost, loan repricing, and credit cost as linked variables rather than extrapolating a quarter’s profit forever. The original report is available for review.
For a core position, a more useful sequence is:
- Begin with capital ratios, provisions, new non-performing formation, and write-offs to judge whether dividends can survive loss absorption.
- Examine margin, non-interest income, and cost-to-income ratio for the durability of profit.
- Compare payout, cash flow, and capital-raising plans to separate distributable capacity from cash already distributed.
- Only then place price-to-book, dividend yield, or a dividend model inside a comparison of risk premia.
The IMF’s 2025 Financial System Stability Assessment for China similarly put the property adjustment, local-government financing vehicles, and macro stress tests in the risk background. Low valuation is not an automatic margin of safety; correlations among risky assets tend to rise under stress. See the IMF assessment summary.
A testable approximation is more useful than “high yield”: shareholder total return ≈ cash dividend yield + growth in book value per share + change in price-to-book. Return on equity, payout, credit cost, and capital constraints jointly shape the first two terms. Expectations and required returns shape the last. This is not a precise valuation equation, but it avoids two common errors: assuming that a falling price-to-book must reverse because the stock is cheap, or that profit growth can all be paid to shareholders.
If ROE falls while risk-weighted asset growth keeps consuming capital and investors demand a higher equity return, distributable profit and valuation can weaken together even before the quoted yield changes. Improving profit, capital buffers, and book value per share may also take time to appear in the price. Track those changes. A return to the purchase price says little by itself about whether the original case still holds.
Credit, balance sheets, and capital run on different clocks
Waiting for an economic recovery does not settle the case for holding bank shares. Banks extend credit, credit affects asset prices, and collateral values affect the next lending decision. Banks participate in the cycle themselves. Follow the debt from the previous expansion: how will it be repaid, who absorbs the losses, and what can each common share earn afterward?
1. Separate four clocks instead of treating the cycle as a calendar
The BIS distinguished conventional business cycles from financial cycles in its 2014 Annual Report. The former center on output and activity; the latter on the mutual reinforcement of credit, property prices, and financing constraints. In the historical samples it discussed, ordinary business cycles often lasted one to eight years and financial cycles roughly fifteen to twenty. These are empirical features of particular samples and methods, not a law that fixes the bottom of China’s economy or A shares at regular intervals. Source: BIS 2014 Annual Report, Chapter IV.
For bank research, record four clocks separately. This is an analytical framework, not four estimated Chinese cycle series. They may overlap or diverge and can be changed by institutions and policy.
| Clock | What to observe | Why might bank shares lag or lead? |
|---|---|---|
| Economy and investment | Orders, income, investment plans, employment, household cash flow | Current income can improve before legacy leverage is repaired; borrowers recover at different rates across regions and industries. |
| Credit and asset prices | Debt expansion, property prices, collateral values, financing conditions | A boom can accumulate risk whose losses appear only after growth slows; quarterly GDP is not a complete risk proxy. |
| Money and funding cost | Policy rates, loan repricing, deposit cost, funding maturity | Lower rates may help borrowers while reducing bank asset yield; liabilities need not reprice at the same speed. |
| Bank capital and accounting recognition | Credit cost, write-offs, CET1, RWA, common-equity issuance | Old losses and capital repair may continue after the economy stabilizes; dividends need not turn with activity. |
Share prices add a clock of expectations. They may anticipate repair before accounts improve or fall while profit grows if the risk premium rises. The bottom in activity, peak credit losses, trough in common-equity profit, and low in share prices should not be treated as one date. Buying after an economic indicator improves does not guarantee a low price; an early rally does not establish repaired asset quality. This article describes mechanisms of divergence and does not estimate a fixed lead for A shares.
A 2018 BIS study of financial cycles and recession risk used quarterly data for 16 advanced economies from 1985 through 2017. That boundary matters. It supports studying financial variables as recession signals, but it cannot provide a Chinese bank purchase year, target price-to-book ratio, or averaging threshold. See “The financial cycle and recession risk”. Cycle theory is useful because it stops one short clock from explaining every long-run risk.
2. Minsky: risk may accumulate when conditions look most stable
Hyman Minsky’s 1992 paper divided financing into hedge finance, where cash flow covers interest and principal; speculative finance, where interest can be paid but principal requires refinancing; and Ponzi finance, where operating cash flow cannot cover interest and new borrowing or asset sales maintain the position. “Ponzi” here is a theoretical cash-flow category, not an accusation of fraud; “hedge” does not refer to a hedge fund. Source: Minsky’s paper and the Levy Institute summary.
For bank analysis, the point is not to label every borrower. It is to identify the source of repayment. Does a loan rely on operating income, on refinancing at maturity, or on continuously rising collateral? All three can service interest in good times but withstand weaker cash flow and tighter finance differently.
Minsky’s argument suggests looking for fragility during a boom as well as during a crisis. A low NPL ratio invites another check: did borrowers collect more cash, did loan growth enlarge the denominator, or did renewals and write-offs change the reported balances? Each explanation needs evidence; speculation does not justify accusing a bank of hiding risk. Special-mention loans, overdue migration, and actual cash collection help test the alternatives.
3. The financial accelerator: asset prices can feed back into credit
Bernanke, Gertler, and Gilchrist’s financial-accelerator framework explains how credit-market friction amplifies and transmits macro shocks rather than treating finance as a passive conduit. Source: NBER Working Paper 6455, 1998. The implication for bank holdings is that pressure can come not only from fewer loans but also from feedback among thinner borrower net worth, tighter financing conditions, and higher credit costs.
A typical collateral loop is easy to describe. Credit expansion supports asset transactions; rising assets improve collateral and financing access; more finance supports further expansion. When cash flow or asset prices weaken, the feedback can reverse. The following diagram is a mechanism, not attribution for every crisis or a measured path for China. Its central reminder is that a bank holds a loan contract backed by borrower cash flows and assets that move with the economy.

The mechanism also qualifies the phrase “defensive bank stocks.” Stable funding and mature earnings do not prevent losses from clustering under stress. Diversifying among ten banks can reduce one company’s governance or execution risk without diversifying a common change in property collateral, regional industry stress, or weak credit demand. In the historical account below, 16 additions clustered in January 2016. That is a feature of the account rules, not evidence of an identified macro turning point.
4. Balance-sheet recession: why cheap money may not create borrowing
Richard Koo’s 2011 paper used Japan after its asset bubble to describe a mechanism different from ordinary demand fluctuation. When asset values fall but debt remains, firms and households may prioritize debt reduction and balance-sheet repair over new borrowing and investment. Low rates and abundant liquidity may then fail to restore private credit demand quickly. Source: “The world in balance sheet recession: causes, cure, and politics”, especially the opening mechanism and Japanese case.
Two effects should be separated in bank analysis. A lower financing burden may reduce borrower defaults, while active deleveraging and deferred investment weaken demand for good loans. Both can occur. “Rate cuts help the real economy” does not translate directly into “bank profits rise.” Bank returns also depend on asset yield, deposit repricing, credit losses, and whether new assets cover the cost of capital.
Whether that explanation fits depends on the industry and region. Are borrowers reducing net financing, repaying more debt, cutting investment, and changing their cash flow? This article does not use the theory to diagnose China as a whole. Japan’s case supplies no timetable for how long another economy would take.
5. China: financial stability and shareholder profitability need separate tests
The IMF’s April 4, 2025 Financial System Stability Assessment for China is directly relevant. It credited regulatory reforms and the capital and liquidity buffers of large banks while also pointing to property adjustment, local-government financing vehicles, the effect of accommodative monetary conditions on organic profitability, and the greater vulnerability of some smaller banks. It supports neither simple optimism nor pessimism. Stability and profitability must be verified separately. See the IMF summary. It describes that assessment, not a live risk rating for September 2026.
Debt extension can relieve a borrower’s current principal burden without raising the project’s future income. A capital injection can increase a bank’s loss-absorbing and lending capacity, while the new share count, issue price, and later return on capital determine whether existing shareholders benefit. The Ministry of Finance, Central Huijin, and local-state actions described later belong in two separate chains: one tests credit and institutional stability; the other tests earnings, book value, and distributions per common share. Policy support does not prove the core-holding case if the second chain is omitted.
The Basel Committee’s 2010 countercyclical capital-buffer guidance makes the same distinction. Its purpose is to build protection when excess credit growth raises systemic risk and release it under stress to reduce the effect of capital constraints on credit supply. Source: BCBS guidance. This explains an international framework, not a claim that China had made a particular release. Applicable domestic requirements and bank-level rules must be checked. Protecting financial intermediation does not guarantee a common-equity return at every purchase price.
6. Put the cycle into valuation without making the best year perpetual
The FCFE, dividend, and residual-income models below need more than the latest ROE. They need assumptions that pass through loss recognition and capital repair. A practical approach separates pre-provision operating capacity from credit cost and asks whether favorable years relied on unusually low losses, rising assets, or rapid loan expansion. A ten-year simple average is not automatically cycle-neutral if the sample never includes concentrated loss recognition.
Check the stable ROE in the valuation model carefully. Carrying a high ROE from a low-credit-cost period straight into terminal value may be optimistic. Weak profit during stress may instead reflect the concentrated recognition of old losses. Ask whether the business can cover credit and capital costs afterward. The table organizes those assumptions; it does not assign a current stage to each of the ten banks.
| Analytical scenario | Variables that should move together | Falsifier that cannot be skipped |
|---|---|---|
| Expansion | Faster loan/RWA growth, possibly low current credit cost, greater retained-capital need | Does high ROE depend on excess expansion or refinancing borrowers? Can high growth coexist with high payout? |
| Loss recognition | Higher credit cost, lower profit, possible capital deductions or risk-weight changes | Is the dividend consuming buffers? Will a capital gap require new common shares? |
| Balance-sheet repair | Loss recognition and disposal, funding-cost adjustment, gradual borrower cash-flow recovery | Is cash collection improving, or have repayment and recognition merely been delayed? What capital and time does repair consume? |
| Normalization | Sustainable ROE, normal credit cost, supportable RWA growth and payout | Does the model restore peak profitability too soon? Are growth and retained capital consistent? |
An economic recovery need not restore a bank’s former profitability. Its funding advantage may weaken, competition may compress margins, or capital requirements may rise. Those changes affect normalized ROE, so a historical P/B high is insufficient as a valuation target. Whether waiting helps still depends on value creation per share.
7. When averaging down, ask whether price or the premise became cheaper
Cycle research does not replace trading rules, but it reveals their blind spots. The 20 and 35 percent drawdown thresholds below use price and dividend indices only. They observe neither borrower repayment, bank buffers, dilution, nor macro cycles. They form a mechanical historical scenario, not a validated “buy the cycle bottom” strategy. Nothing in this section changes the backtest or gives its thresholds retroactive theoretical authority.
A better next step puts current price drawdown alongside credit fragility, bank buffers, and value-per-share changes. BIS research on early-warning indicators for banking crises examined credit-to-GDP gaps and debt-service ratios. The first measures credit’s deviation from trend; the second principal and interest burden relative to income. These are systemic-risk tools, not stock-return forecasts or ready-made Chinese trading signals. Source: Drehmann and Juselius, BIS Working Paper 421, 2013.
Three review questions follow. Does the borrower still have a source of repayment? Can the bank maintain its capital requirement after recognizing reasonable losses? Under the current share count, can common dividends and normalized ROE still support the valuation? The aim is not to call the exact bottom but to distinguish a lower price on an intact foundation from a lower price accompanied by weaker value.
A future macro backtest would need the values actually published at each date and their release times, with revisions and trend-estimation endpoint problems handled explicitly. A bottom identified using today’s complete history may not have been visible then. Cycle analysis should also help assess whether cash can cover a lengthy repair period, before a large price decline consumes the entire addition budget.
A 2015–2026 scenario: RMB 500,000 plus up to RMB 500,000
This is neither a forecast nor a directly reusable recommendation. Fixed parameters set today are applied to history. The narrow question is what happened when ten sample stocks began at equal weights in early 2015 and received mechanical additions after large drawdowns, combining prices with pretax cash dividends. It does not imply that an investor in 2015 had already selected these parameters or companies for these reasons.
The thresholds were triggered in 2016 and 2022, so the rule used only RMB 425,000 of the RMB 500,000 additional capacity. “Up to” does not mean the full amount must be deployed.
| Scenario | External contributions | Value on 2026-09-04 | Pretax dividend cash within value | Cumulative return on contributed capital | Money-weighted annual return | Maximum drawdown (time-weighted) |
|---|---|---|---|---|---|---|
| RMB 500,000 initially, no additions | RMB 500,000 | RMB 1.202m | RMB 313,000 | 140.5% | 7.8% | -36.9% |
| RMB 500,000 initially, rule-based additions | RMB 925,000 | RMB 2.282m | RMB 572,000 | 146.7% | 8.5% | -36.9% |
| RMB 1m invested once in early 2015 | RMB 1m | RMB 2.415m | RMB 629,000 | 141.5% | 7.9% | -37.1% |
Separate three return measures
Cumulative return is ending value divided by actual cumulative contributions minus one. It ignores contribution dates and cannot be annualized by dividing by years. Money-weighted annual return (XIRR) uses each contribution date and ending value to answer what the invested money earned along that funding path. Time-weighted return removes the effect of external cash flows day by day to describe the account’s internal asset growth. The model treats contributions as arriving at the start of a trading day, marks stocks at the close, and pays no interest on cash.
The three time-weighted annual returns were about 7.65, 7.65, and 7.69 percent. The 8.5 percent XIRR for rule-based additions minus the 7.8 percent XIRR without additions is therefore not repeatable stock-selection or timing alpha. Contribution timing, holdings, and cash all affect it. The one-time RMB 1 million scenario ended higher partly because more money entered earlier.

The -36.9 percent path is the number not to overlook. The account reached a high on June 8, 2015, hit maximum drawdown on August 25, and did not exceed the old high until August 2, 2017—786 calendar days later. Ending with RMB 2.282 million did not make the experience easy. An investor unable to accept a fall near 40 percent, or unwilling to continue the rule afterward, could not realize the terminal figure. Additions raised the money-weighted return in this sample but did not remove drawdown or prove that the next stress period will follow the same sequence.
The “diversified” addition rule was not diversified in stress. All ten first additions at a 20 percent drawdown executed on January 12, 2016. Of seven second additions at 35 percent, six occurred in January 2016 and one for China Merchants Bank on May 10, 2022. Sixteen of seventeen additions clustered in one month. The rule was still in its 250-day warm-up during the 2015 maximum drawdown, so this does not establish that additions generally fail to reduce drawdown. It does establish that ten banks did not create seventeen independent opportunities. Holding ten banks does not create ten independent sources of risk under common credit, liquidity, and rate stress.

Figure 3 does not show dividend capacity compounding at that rate every year. Concentrated additions in 2016 increased the share count; stock distributions and later additions changed it again. Company dividend growth requires decomposing total cash into shares held times dividend per share.
The ending account reconciles as follows: RMB 1.6933 million in stock + RMB 572,100 in pretax dividend cash + RMB 16,700 left after whole-lot purchases = RMB 2.2821 million. Total commission of RMB 272.41 was deducted in purchase costs. The unused RMB 75,000 addition budget never entered the securities account and is not in its cash or value. If treated as household reserve cash earning zero, the full RMB 1 million budget ended at RMB 2.3571 million, a cumulative 135.71 percent. That household-budget denominator must not be mixed with the RMB 925,000 actually contributed in the table.
What did each bank contribute?
The ledger below is from the rule-based scenario. Amounts are RMB 10,000 and rounded to two decimals. “Budget” includes unspent remainder after purchases; “purchase cost” includes commission. Dividend cash is already inside account cash and must not be added again to ending value.
| Bank | Budget | Purchase cost | Ending stock value | Cumulative pretax dividends | Additions |
|---|---|---|---|---|---|
| ICBC | 7.50 | 7.47 | 12.85 | 5.01 | 1 |
| China Construction Bank | 10.00 | 9.85 | 18.67 | 6.58 | 2 |
| Agricultural Bank of China | 7.50 | 7.45 | 14.76 | 4.92 | 1 |
| Bank of China | 10.00 | 9.95 | 16.75 | 5.96 | 2 |
| Bank of Communications | 10.00 | 9.91 | 11.65 | 5.80 | 2 |
| China Merchants Bank | 10.00 | 9.53 | 21.26 | 7.47 | 2 |
| Industrial Bank | 7.50 | 7.26 | 8.02 | 4.35 | 1 |
| Ping An Bank | 10.00 | 9.85 | 11.73 | 3.41 | 2 |
| Bank of Ningbo | 10.00 | 9.78 | 33.73 | 6.12 | 2 |
| Bank of Nanjing | 10.00 | 9.77 | 19.93 | 7.61 | 2 |
Source: local calculation output rule_additions_per_bank.csv. This is not a return ranking: contribution dates and amounts differ, and the portfolio is not rebalanced. Initial equal weights do not remain equal. Bank of Ningbo ended at about 19.9 percent of stock value, nearly twice its initial 10 percent. Whether to restore target weights is a separate strategy question.
The script, orders, daily net asset value, individual dividends, and de-duplicated corporate-action records are stored with the repository under research/experiments/a_share_bank_core_holdings_v1/ and can be recalculated on the same basis. “Dividend contribution” means pretax cash not reinvested; total return includes that cash alongside closing market value.
Public calculation materials: offline script, scenario comparison, and per-bank ledger. These attachments are byte-for-byte copies of the research files. Running the script also requires local price and dividend evidence, which is not distributed with these attachments.
An important comparison is missing: the study includes no CSI 300, bank index, or dynamic investable-universe control, so it cannot establish whether the ten-bank portfolio beat an index. The results describe this fixed sample under the stated rules. Relative performance needs a benchmark over a common period and on a consistent basis.
Three more boundaries remain. Cash is recognized on ex-dates even though the real spendable date may be later. Stock distributions are rounded to holdings, without modeling every clearing remainder, rights subscription, or corporate action. The calculation uses local caches and has not independently cross-audited every quote and action against issuer notices. “An account model using real historical inputs” is more accurate than “brokerage-account performance.” The common cache cutoff is September 4, 2026, not the full month or publication date, and policies discussed after September 7 are not inserted retrospectively into the test.
A bank is not valued like an ordinary company’s free cash flow
For a bank DCF, start by deciding which cash can be distributed to common shareholders. Simply subtracting capital expenditure from operating cash flow is often inappropriate. Taking deposits, lending, and holding reserves are ordinary bank operations, while regulatory capital limits distributions. Applying a manufacturer’s cash-flow treatment can miss those constraints.
A better translation of free-cash-flow thinking is capacity distributable to common shareholders, cross-checked through at least three frameworks:
| Framework | Core question | Inputs that matter most for a bank |
|---|---|---|
| FCFE | After growth and regulatory capital, how much cash can common equity receive? | Net income, RWA growth, target capital ratio, capital issuance |
| Dividend discount model | What is the present value of paid and sustainable dividends? | Long-run payout, earnings growth, cost of equity, capital constraint on distributions |
| Residual income | Can future ROE remain above the cost of equity? | Opening book value, ROE, cost of equity, retention rate |
One auditable approximation is sustainable dividend ≈ net income − retained capital needed to maintain the target capital ratio. In residual income, value begins with opening book value + the present value of future (ROE − cost of equity) × opening book value. Neither produces one automatic price target. Both require internally consistent assumptions about ROE, credit cost, capital, and growth.
A full equity DCF discounts each period’s distributable cash: common-equity value = Σ FCFE_t / (1 + Ke)^t + terminal value / (1 + Ke)^N, where Ke is the cost of common equity. Under stable growth, terminal value = FCFE_(N+1) / (Ke − g). This is not a WACC discount of free cash flow to the firm, and proceeds from issuing shares are not sustainable cash produced for existing holders. As growth approaches the cost of equity, terminal value becomes extremely sensitive; a model should disclose the terminal share of total value instead of showing only its final price.
I would set out low, central, and high cases for each bank, checking margins, credit costs, RWA growth, and payout together. If a high valuation requires ROE to stay above the cost of equity indefinitely while the bank never needs more capital, ask how both assumptions can hold. Used this way, a DCF makes the underlying bet easier to see.
Translate “free cash flow” into a capital constraint
The common error in bank FCFE is to treat cash from operations as distributable. Deposit inflows, new lending, and interbank positions are ordinary banking activity, not inventory adjustments to remove from free cash flow. A first approximation closer to the common-equity constraint is:
Retained capital required to maintain target CET1
≈ target CET1 ratio × increase in risk-weighted assets (RWA)

Sustainable capacity for common dividends
≈ profit attributable to common equity − required retained capital
  − new regulatory deductions / buffer requirements
  (then account for dilution from external common-equity issuance)
This is not a regulatory reporting formula. Actual CET1 also reflects other comprehensive income, deferred tax, capital instruments, and deductions. RWA can change because of weights rather than loan growth. The approximation nevertheless forces a neglected question: How much common equity must be locked up for one additional unit of RWA? A model that assumes high growth, high payout, and no financing must identify the source of the capital.
Profit must also match the claim. Distributions owed to preferred shares, perpetual capital securities, and other equity holders should be deducted from profit attributable to the parent before discussing common dividends. If the target capital ratio rises, existing RWA also requires more capital. External issuance replenishes capital but is not free cash flow created by existing holders.
In a stable-growth DDM or residual-income check funded by retained profit, g ≈ ROE × retention rate, and P/B ≈ (ROE − g) / (cost of equity − g). ROE must use opening common book value, cost of equity must exceed growth, and the simplified relation assumes no new share issue and continuity between earnings and book value. It is a consistency check rather than a quote. A low P/B can mean low sustainable ROE or a high required return; those interpretations have very different portfolio implications.
A worked example: high growth need not mean high payout
Every number in this example is illustrative and refers to no bank’s actual accounts or price target. Assume RMB 10 billion of common profit, opening RWA of RMB 1 trillion, and a 10 percent target CET1 ratio that is exactly met. Five percent RWA growth adds RMB 50 billion of RWA and needs roughly RMB 5 billion of common capital, leaving simplified distribution capacity of RMB 5 billion. At eight percent growth, RMB 8 billion must be retained, leaving RMB 2 billion. If the target ratio also rises from 10 to 11 percent, the five percent growth case raises required capital from RMB 100 billion to RMB 115.5 billion. Profit of RMB 10 billion cannot cover the RMB 15.5 billion increase, much less be fully paid out.
Now use a stable-growth cross-check with long-run growth fixed at three percent. The theoretical P/B values below are model scenarios, not forecasts.
| Sustainable ROE | Cost of equity 9% | Cost of equity 10% | Cost of equity 11% |
|---|---|---|---|
| 8% | 0.83x | 0.71x | 0.63x |
| 10% | 1.17x | 1.00x | 0.88x |
| 12% | 1.50x | 1.29x | 1.13x |
At 10 percent ROE and three percent growth, retention is 30 percent and payout 70 percent. With a 10 percent cost of equity, theoretical P/B is one. If ROE falls to eight percent and cost of equity rises to 11 percent, theoretical P/B is about 0.63 despite positive growth. A price below book may be an opportunity or a reasonable price for weak capital returns. Profit and capital assumptions must come first.
Ask four consecutive questions of a bank DCF. Does projected profit deduct sufficient credit cost? Is RWA growth consistent with the CET1 target? Do dividends and external financing coexist without double counting? If ROE exceeded the cost of equity only in one or two favorable years, why should residual income persist? A model that survives those questions is worth comparing with market price.
Shareholders, governance, and policy belong in the research file
A bank cannot be read from the income statement alone. Control over capital raising, board appointments, and risk appetite affects common equity on both the upside and downside. As examples from 2025 annual reports, China Construction Bank and Bank of China had state-ownership structures centered on Central Huijin and the Ministry of Finance; China Merchants Bank’s largest shareholder was China Merchants Steam Navigation; Industrial Bank had major holdings from the Fujian finance department and a provincial financial-investment platform. Percentages change with reporting periods and transactions, so they should be checked in each “major shareholders” table: China Construction Bank, Bank of China summary, China Merchants Bank, and Industrial Bank reports.
The table is a control and capital-constraint worksheet, not a reduction of top shareholders to background labels. It classifies relationships to verify in 2025 reports and related disclosures without presenting trading-day-sensitive percentages. Percentages, pledges, aggregation of connected parties, and board-nomination rights require line-by-line checking against company reports and articles.
| Sample | Ownership or control relationship to identify | Common-equity question |
|---|---|---|
| ICBC, CCB, ABC, BOC | State ownership centered on Central Huijin, the Ministry of Finance, and other state-capital holders | How do stability goals, capital support, and policy lending affect ROE, dividends, and capital per share? |
| Bank of Communications | State shareholders including the Ministry of Finance alongside a strategic financial investor | Does a multi-shareholder structure alter capital raising, governance, and transmission of cross-border risk? |
| China Merchants Bank | Important direct and indirect holdings in the China Merchants group; the annual report also says it has no controlling shareholder or actual controller | Do not confuse influence of the largest shareholder with legal control; how do the board, related transactions, and capital plans operate? |
| Industrial Bank | Fujian’s finance department and wholly owned Fujian Financial Investment together form the disclosed large holding and appoint directors | Does a local fiscal/financial platform bring both a capital and governance role and regional policy exposure? |
| Ping An Bank | Controlled within the Ping An insurance group | Are group resources, retail strategy, and capital plans aligned with return per share for minorities? |
| Bank of Ningbo | Local Ningbo state capital and overseas strategic investors among a diverse shareholder base | Are local exposure, the strategic investor’s role, and equity stability sustainable? |
| Bank of Nanjing | Local state capital, financial institutions, and industrial capital in a diverse structure | How do ownership changes, local related risk, and outside capital alter governance and dilution? |
The purpose is not to score shareholders. It is to separate three chains. The ownership chain determines who has influence at critical moments. The capital chain determines who supplies capital after losses and whether existing value per share is diluted. The risk chain maps exposure to local government, property, interbank markets, or group customers. They may overlap or diverge. Industrial Bank’s public major-shareholder assessment, for example, reported a combined 20.57 percent holding by the Fujian Department of Finance and Fujian Financial Investment at year-end 2025, with appointed directors. That is a verifiable ownership and governance fact, not a dividend or price forecast. See the original disclosure.
To avoid a shareholder table that looks complete but is stale, use annual reports as entry points rather than a secondary database: ICBC, Agricultural Bank of China, Bank of Communications, Ping An Bank, Bank of Ningbo, and Bank of Nanjing. A report-period date and announcement date are not the current trading date; preserve both.
“Government ownership” is not one variable
The stronger question is which national or local body acquired, transferred, or increased which right, on what date, through which legal and capital instrument. Ministry of Finance special bonds, Central Huijin’s investor holdings, transfers of state capital to the social-security fund, and local state-platform shares are not one form of support. An insurer’s control of Ping An Bank is another corporate relationship and does not become government ownership because it sits in a financial group.
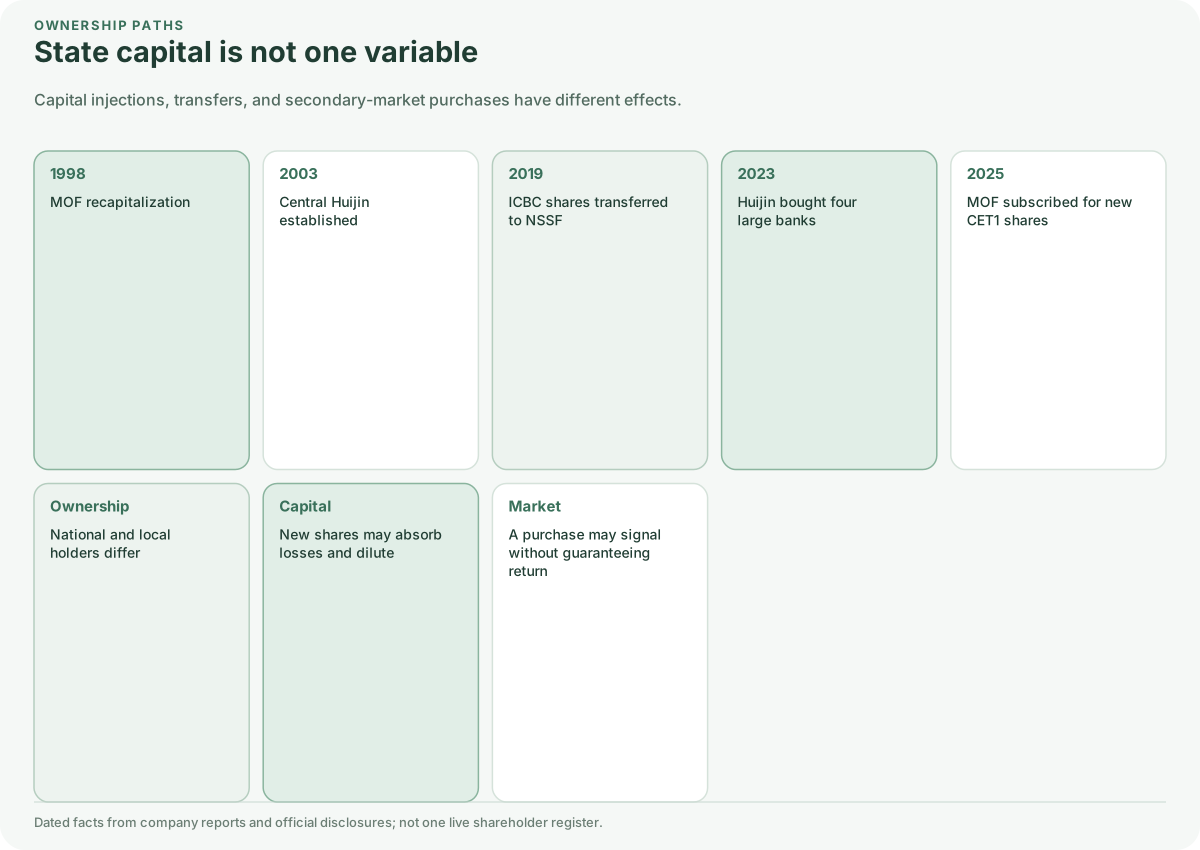
The figures in the diagram return to primary disclosures. ICBC’s 2025 major-shareholder assessment reported combined A- and H-share holdings of 34.79 percent for Central Huijin, 31.14 percent for the Ministry of Finance, and 5.35 percent for the National Council for Social Security Fund. Agricultural Bank of China reported 40.14, 35.29, and 6.72 percent respectively. These numbers do not show a guarantee for common equity. They show why research on per-share capital, rights, and state-capital changes must state whether multiple holders are combined. See the ICBC assessment and ABC assessment.
The historical path cannot be reduced to Central Huijin. ICBC’s 2024 annual-report summary records a 2019 transfer of 12,331,645,186 A shares from the Ministry of Finance to the state-capital transfer account of the social-security fund. That changed which state body held the capital and the applicable lock-up; it was neither a company buyback nor newly earned profit. Central Huijin’s 2023 purchases of A shares in four large state banks were secondary-market actions by a controlling shareholder. In 2025, by contrast, the Ministry of Finance subscribed in cash to private placements that replenished CET1. CCB issued 11,589,403,973 A shares and raised RMB 105 billion; Bank of China announced a Ministry of Finance subscription cap of RMB 165 billion and later completed the issue. Sources: ICBC 2024 summary, 2023 Huijin announcement, CCB 2025 report, and Bank of China completion notice.
Local and group paths change too. Industrial Bank’s 2025 material shows the combined 20.57 percent Fujian holding and appointed directors. Bank of Ningbo’s company profile says Ningbo Development Investment and parties acting in concert represent roughly 20 percent held for the government, but the profile does not date that snapshot and cannot serve as a live register. Bank of Nanjing’s 2015 report listed BNP Paribas at 14.87 percent and Nanjing Zijin Investment at 12.41 percent, illustrating an overseas financial institution alongside local state capital. Ping An Bank’s 2015 report gives a dated control history: China Ping An and Ping An Life held 52.38 percent after the 2011 restructuring, 59 percent after a 2013 placement, and 58 percent after the May 2015 placement. A 2011 historical number inside a 2015 report is not a 2015 year-end holding. Sources: Industrial Bank, Bank of Ningbo profile, Bank of Nanjing 2015 report, and Ping An Bank control history.
For common-equity research, put each state-capital action in one of three columns. Did it change the bank’s capital, rights among shareholders, or secondary-market holdings? Only the first directly raises loss-absorbing resources. The second may affect control and dilution per share. The third mainly changes market signaling. All can matter; none guarantees a common-equity return.
The policy timeline belongs beside the valuation model:
| Period | Public action | Implication for common equity |
|---|---|---|
| 1998–1999 | Special government bonds recapitalized wholly state-owned commercial banks; four asset-management companies received non-performing assets | Systemic repair changes capital and balance sheets, so historical profit cannot be extrapolated alone. 1998 document; 1999 document. |
| 2003–2005 | Central Huijin was established and injected capital alongside joint-stock reform and listings | The state investor, corporate governance, and market listing are separate layers; trace the capital source, board mechanism, and value per share. Official reform review. |
| 2019 | Regulators took over Baoshang Bank | Liquidity, governance, and resolution at one institution cannot be replaced with an assumption that every bank is too big to fail. State Council report. |
| 2023 | Central Huijin increased holdings in four large state banks | A controlling-shareholder action may influence expectations but is not an unconditional endorsement of every bank valuation. Xinhua announcement. |
| 2025 | The Ministry of Finance issued the first special bonds supporting CET1 replenishment at large state banks | Capital constraints and macro policy directly affect dividends, growth, and dilution and belong in the scenario inputs. Ministry explanation. |
| 2026-09-07 | The Ministry announced an upcoming RMB 300 billion special-bond issue supporting CET1 at eight central financial enterprises including ICBC and ABC | RMB 300 billion is the total for eight institutions, not an amount for each bank or proof of completed injection. Bank-level issues, subscriptions, and receipt of capital still require verification. The notice came after the backtest cutoff. Ministry notice. |
State ownership is therefore part of governance and policy transmission, not an automatic valuation factor. It may reduce some tail risks while bringing capital allocation, policy concessions, and governance aims that do not perfectly align with short-run common-equity returns. System stability, protection of depositors and creditors, and common-shareholder returns are three different things.
Keep price, cash, and research records separately
Bank investors can react in opposite ways: a dividend payment makes price and asset-quality risks easier to dismiss; a deep fall then makes every earlier judgment feel wrong. Both reactions can skip the work of checking new evidence.
Before buying, write down how you would respond. What drawdown would disrupt household plans? Which deterioration would pause additions? How would a dividend cut, capital pressure, governance event, or dilutive financing change the position? Waiting until a fall to decide makes it easier to react to price alone.
A quarterly research table makes the commitments concrete. These are review methods, not universal trading thresholds. Large state banks, joint-stock banks, and city commercial banks should be compared with their own histories and suitable peers.
| Observation | Misleading single number | Evidence and response to check together |
|---|---|---|
| Asset quality | A lower NPL ratio means risk fell | Combine special-mention loans, overdue migration, new NPLs, write-offs, and loan growth. If larger write-offs reduced the ratio, review losses before adding mechanically. |
| Capital buffer | A high total capital ratio permits higher dividends | Isolate CET1, RWA growth, and institution-specific requirements; preferred and Tier 2 capital do not replace common equity. |
| Profitability | Positive profit growth means improvement | Check margin, pre-provision profit, credit cost, and common ROE. Did profit depend on lower provisions or one-offs? |
| Shareholders and financing | A major shareholder purchase creates value per share | Separate secondary-market purchases, transfers, and new issuance; check issue price, common share count, and book value per share. |
| Household capacity | Unused allocation should always be invested | Cover planned living expenses first. A terminal backtest value is unattainable if stress forces a sale. |
The review table is for subsequent research. The mechanical backtest contains none of these pause conditions, so there is no evidence that they improved its historical return. The table can remind readers what to check at the next decision beyond the fact that the price is lower.
Dividends may provide behavioral support by returning cash even when the price is flat. They should never become an anesthetic against asset-quality analysis. In this scenario, unreinvested dividends formed an important part of ending cash while maximum drawdown still approached 40 percent. Both facts belong in memory.
Keep separate records: a price ledger for market value and drawdown, a cash ledger for dividends, remaining addition capacity, and planned expenses, and a research ledger for quarterly indicators and pause conditions. This lets you check a falling price, funding needs, and a changed investment case separately. Watching the purchase price alone makes those questions hard to distinguish.
The 2015 case is a practical stress test: first a high, then -36.9 percent, then roughly two years to recover. Any averaging rule should ask what happens if recovery takes twice as long, dividends fall, or household cash is needed at the same time. If the rule would break, a smaller equity allocation or larger cash buffer may be the right adjustment—not a prettier historical threshold.
Conclusion, falsification, and an execution checklist
This history offers reasons to continue studying long-term bank holdings, with limits. Dividends returned cash, and capital and governance can be monitored. Yet the banks differed substantially, and holding several did not remove their common credit risks. The study establishes neither that banks will beat other industries nor that dividends will always recoup price losses.
Before acting, complete at least this checklist:
- Check capital, provisions, non-performing exposures, margin, the dividend plan, and major shareholders in the latest reports instead of repeating an old number.
- Cross-check at least two of FCFE, dividend-discount, and residual-income models, with stress tests for ROE, credit cost, and capital ratios.
- Set industry and single-bank position limits and conditions for pausing additions in advance.
- Put a drawdown over 30 percent into the household cash-flow plan.
- Separate a research case, personal risk capacity, and suitability advice. Seek a licensed professional if specific investment advice is needed.
When the next quarterly report arrives, return to the indicators recorded in advance. Do capital, asset quality, and earnings per share still support the original judgment? Long holding periods need continued observation and review, not just more elapsed years.